Investigation
Searching in Investigate
Investigate is located in the top navigation menu. Search is primarily a research and investigative tool, whereas Monitoring is primarily used for defined workflows and filter sets.
Using Investigate provides the user open access to all of Sigma360’s risk intelligence as part of a consolidated, one-off, query. This search includes:
-
Global watchlists and sanctions lists
-
Global enforcement, PEP and other lists
-
Proprietary Sigma Intel on risk-on addresses, corporate service providers, etc.
-
Over 220,000 multi-lingual news sources
-
Corporate registry data on over 850 million Entities (companies and people)
-
International trade data
-
Legal and regulatory records
-
Major leaks such as the Panama Papers, Pandora Papers, etc.
-
Investigative journalism from all major continents
Overall, Investigate allows a user to effectively and efficiently gather and assess information on Entity non-credit risk. Sigma360's proprietary risk model assigns risk ratings in comprehensive risk categories, including sanctions, adverse media, and PEP status.
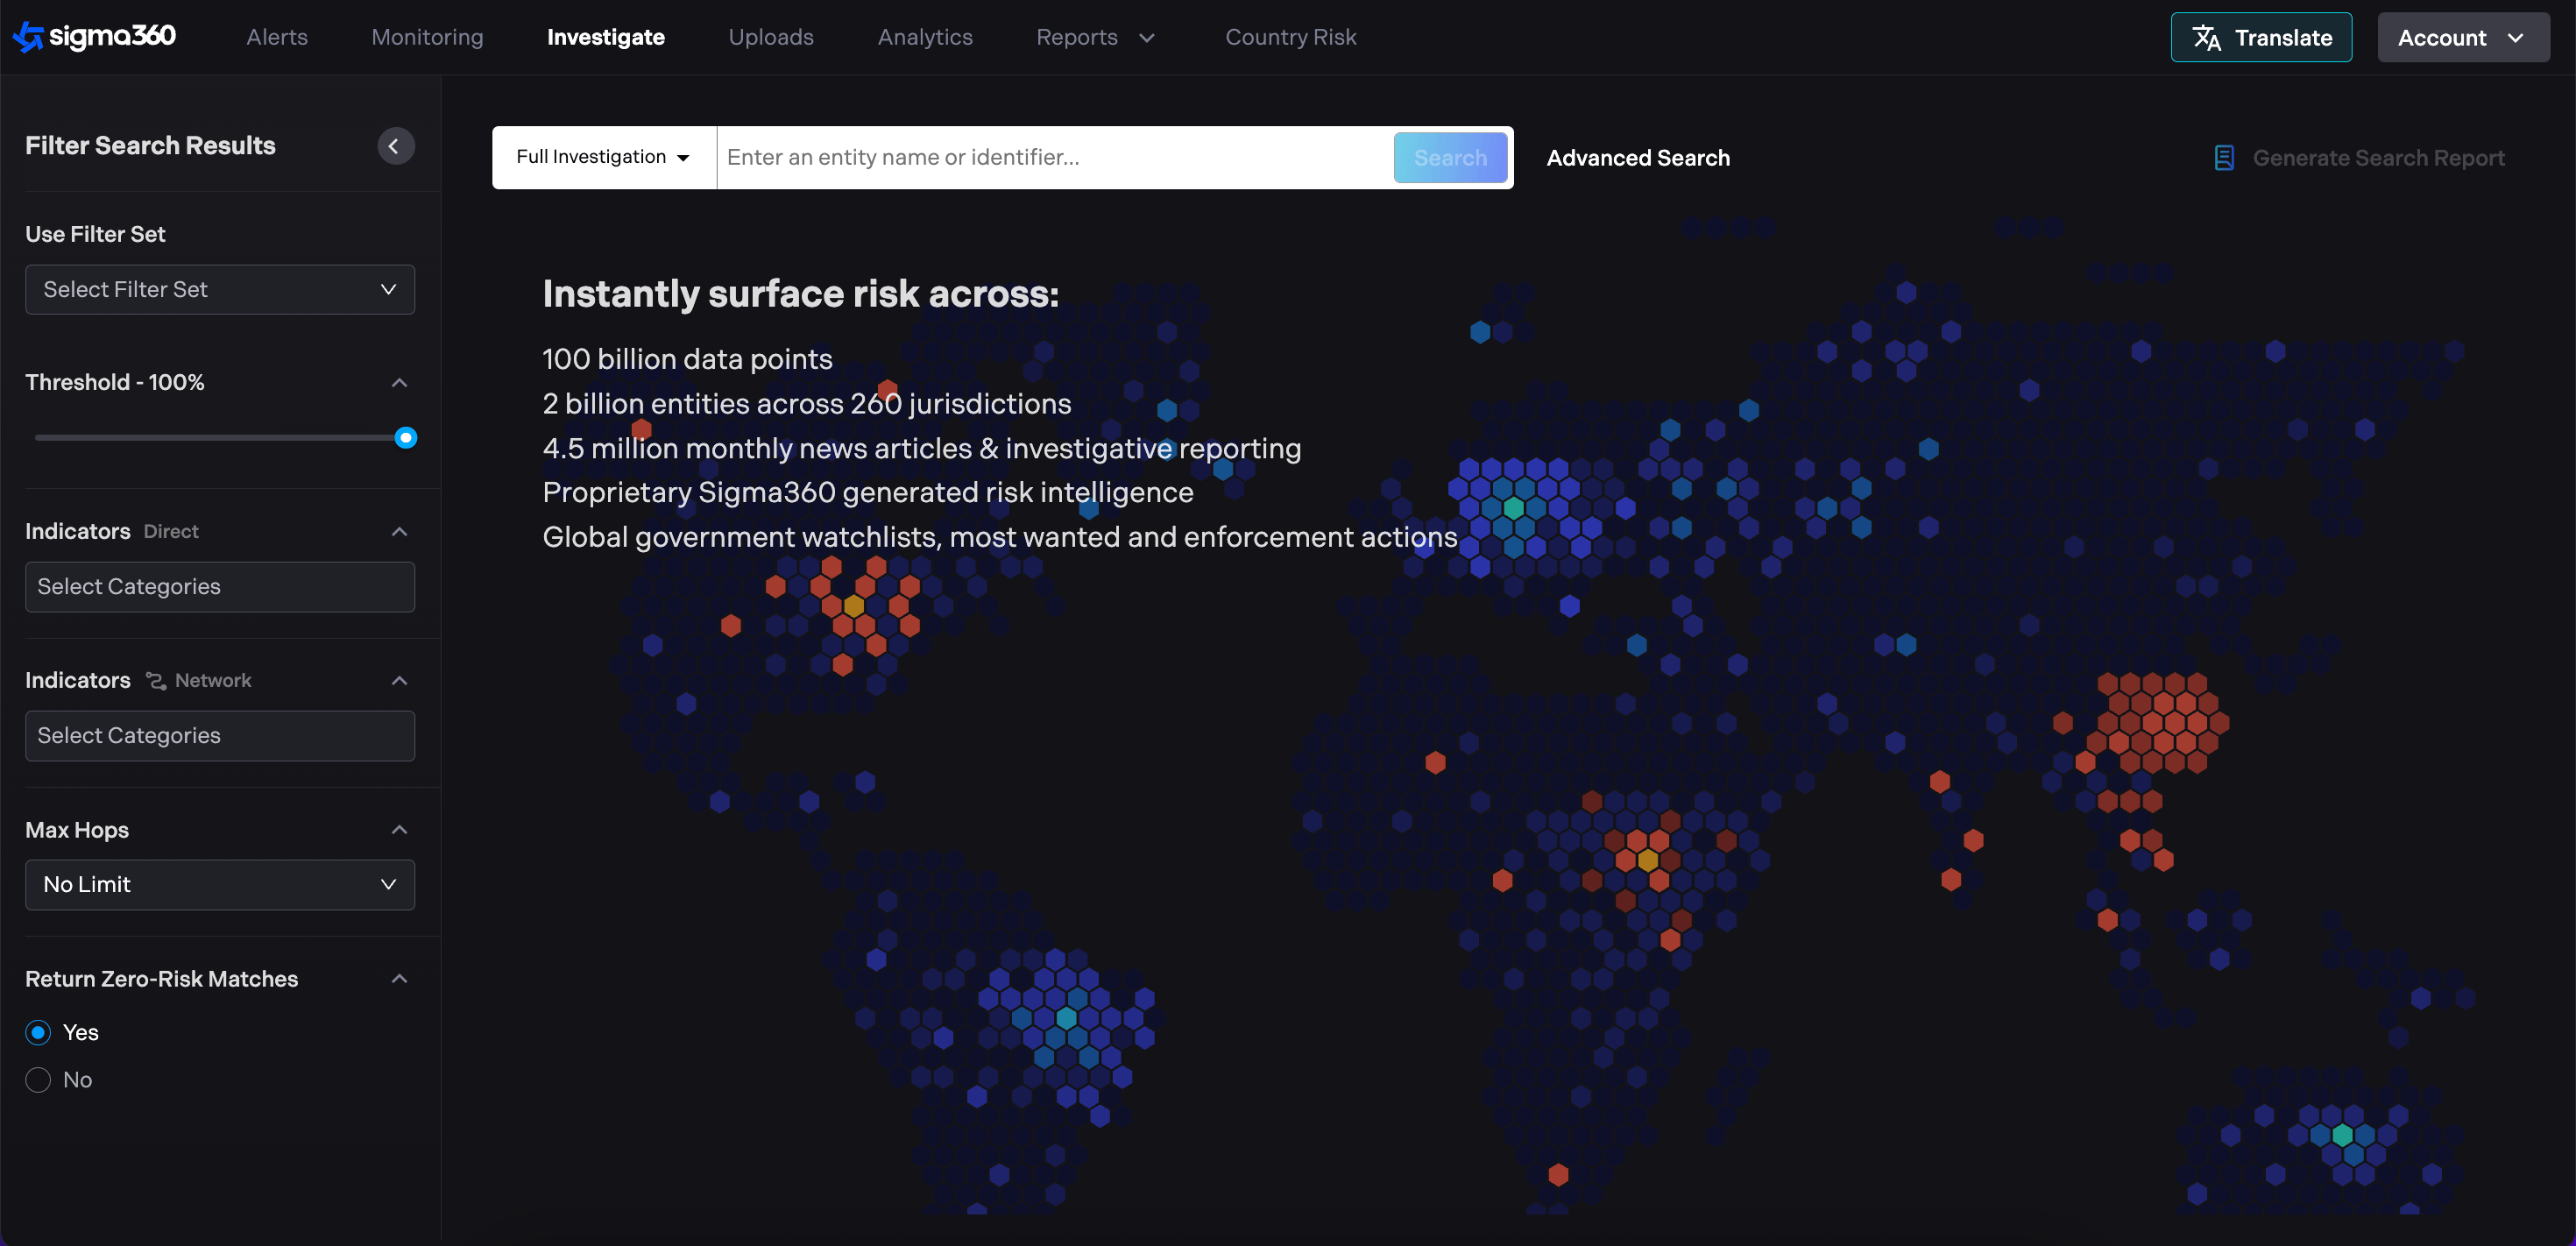
Search function
Search bar - Enter the name of the Entity you would like to return results for. Users may also search by LEI number using Investigate - this will return all information Sigma360 has associated with that LEI number and that has been effectively resolved to that LEI number. Users can also use Investigate to look up information by OFAC ID.
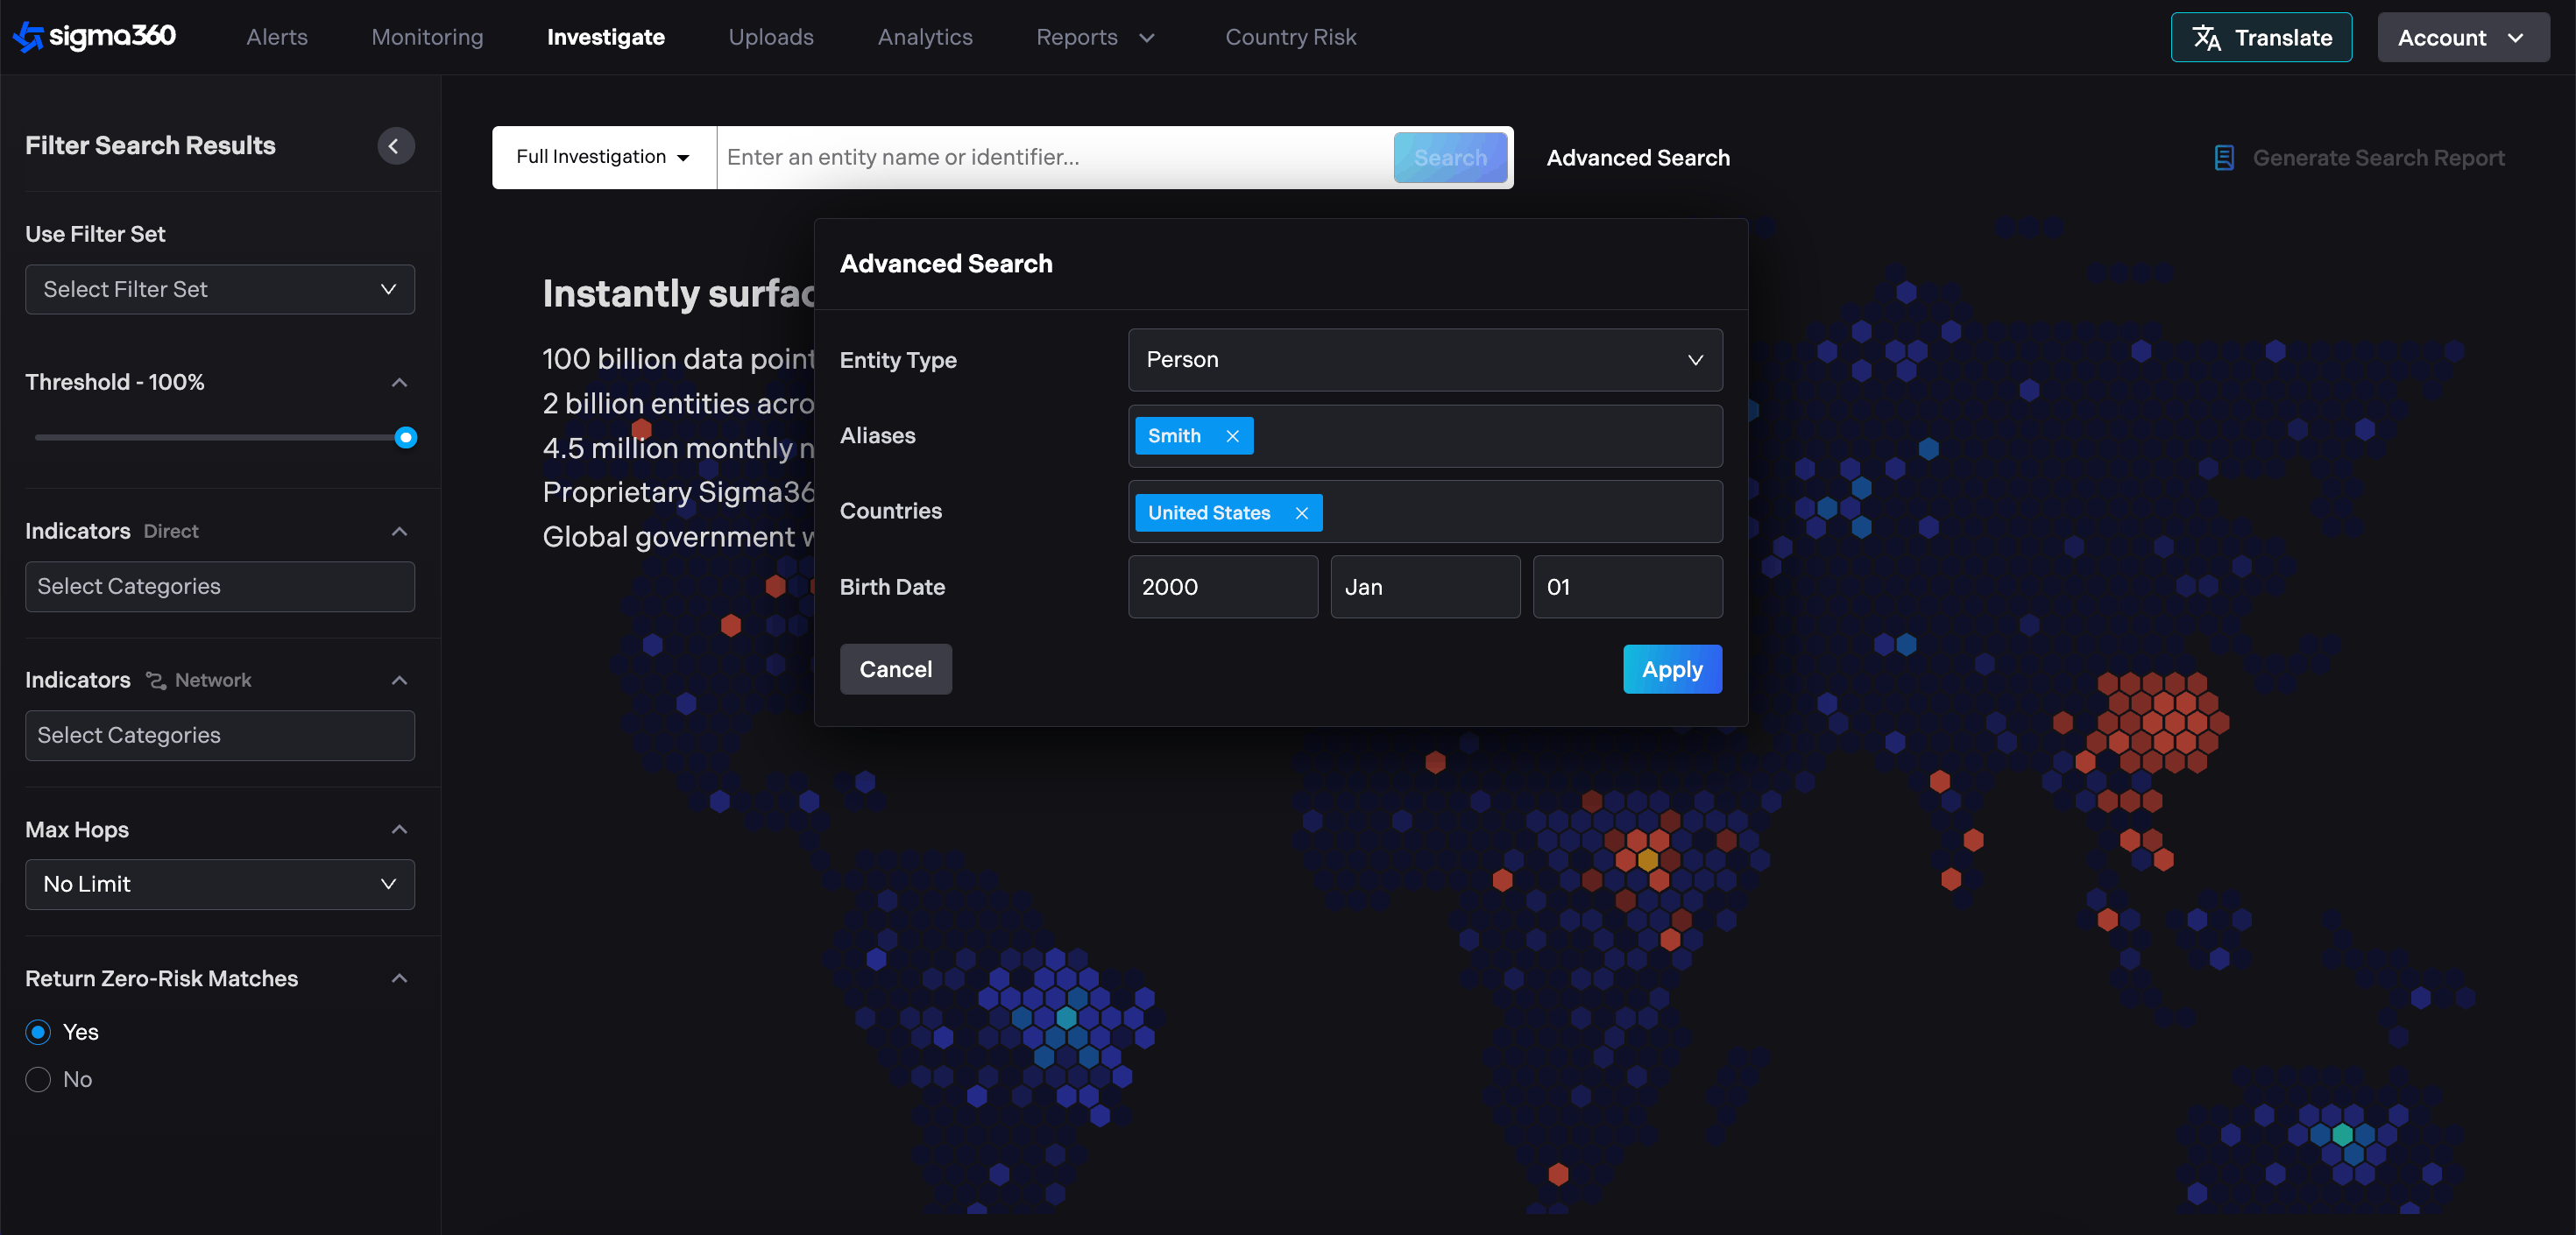
Aliases (Optional) - The aliases search box can be used to input multiple additional spellings or related Entities to be included in the search results.
Search type filter (Optional) - The left side of the search bar has a filter for search type, including Entity type (company, vessel, or natural person), and for news results only. Default is set to all.
Countries (Optional) - Select one or multiple country or region filters. Default is set to all.
Birth Date (Optional) - Select a birthday range as part of the search.
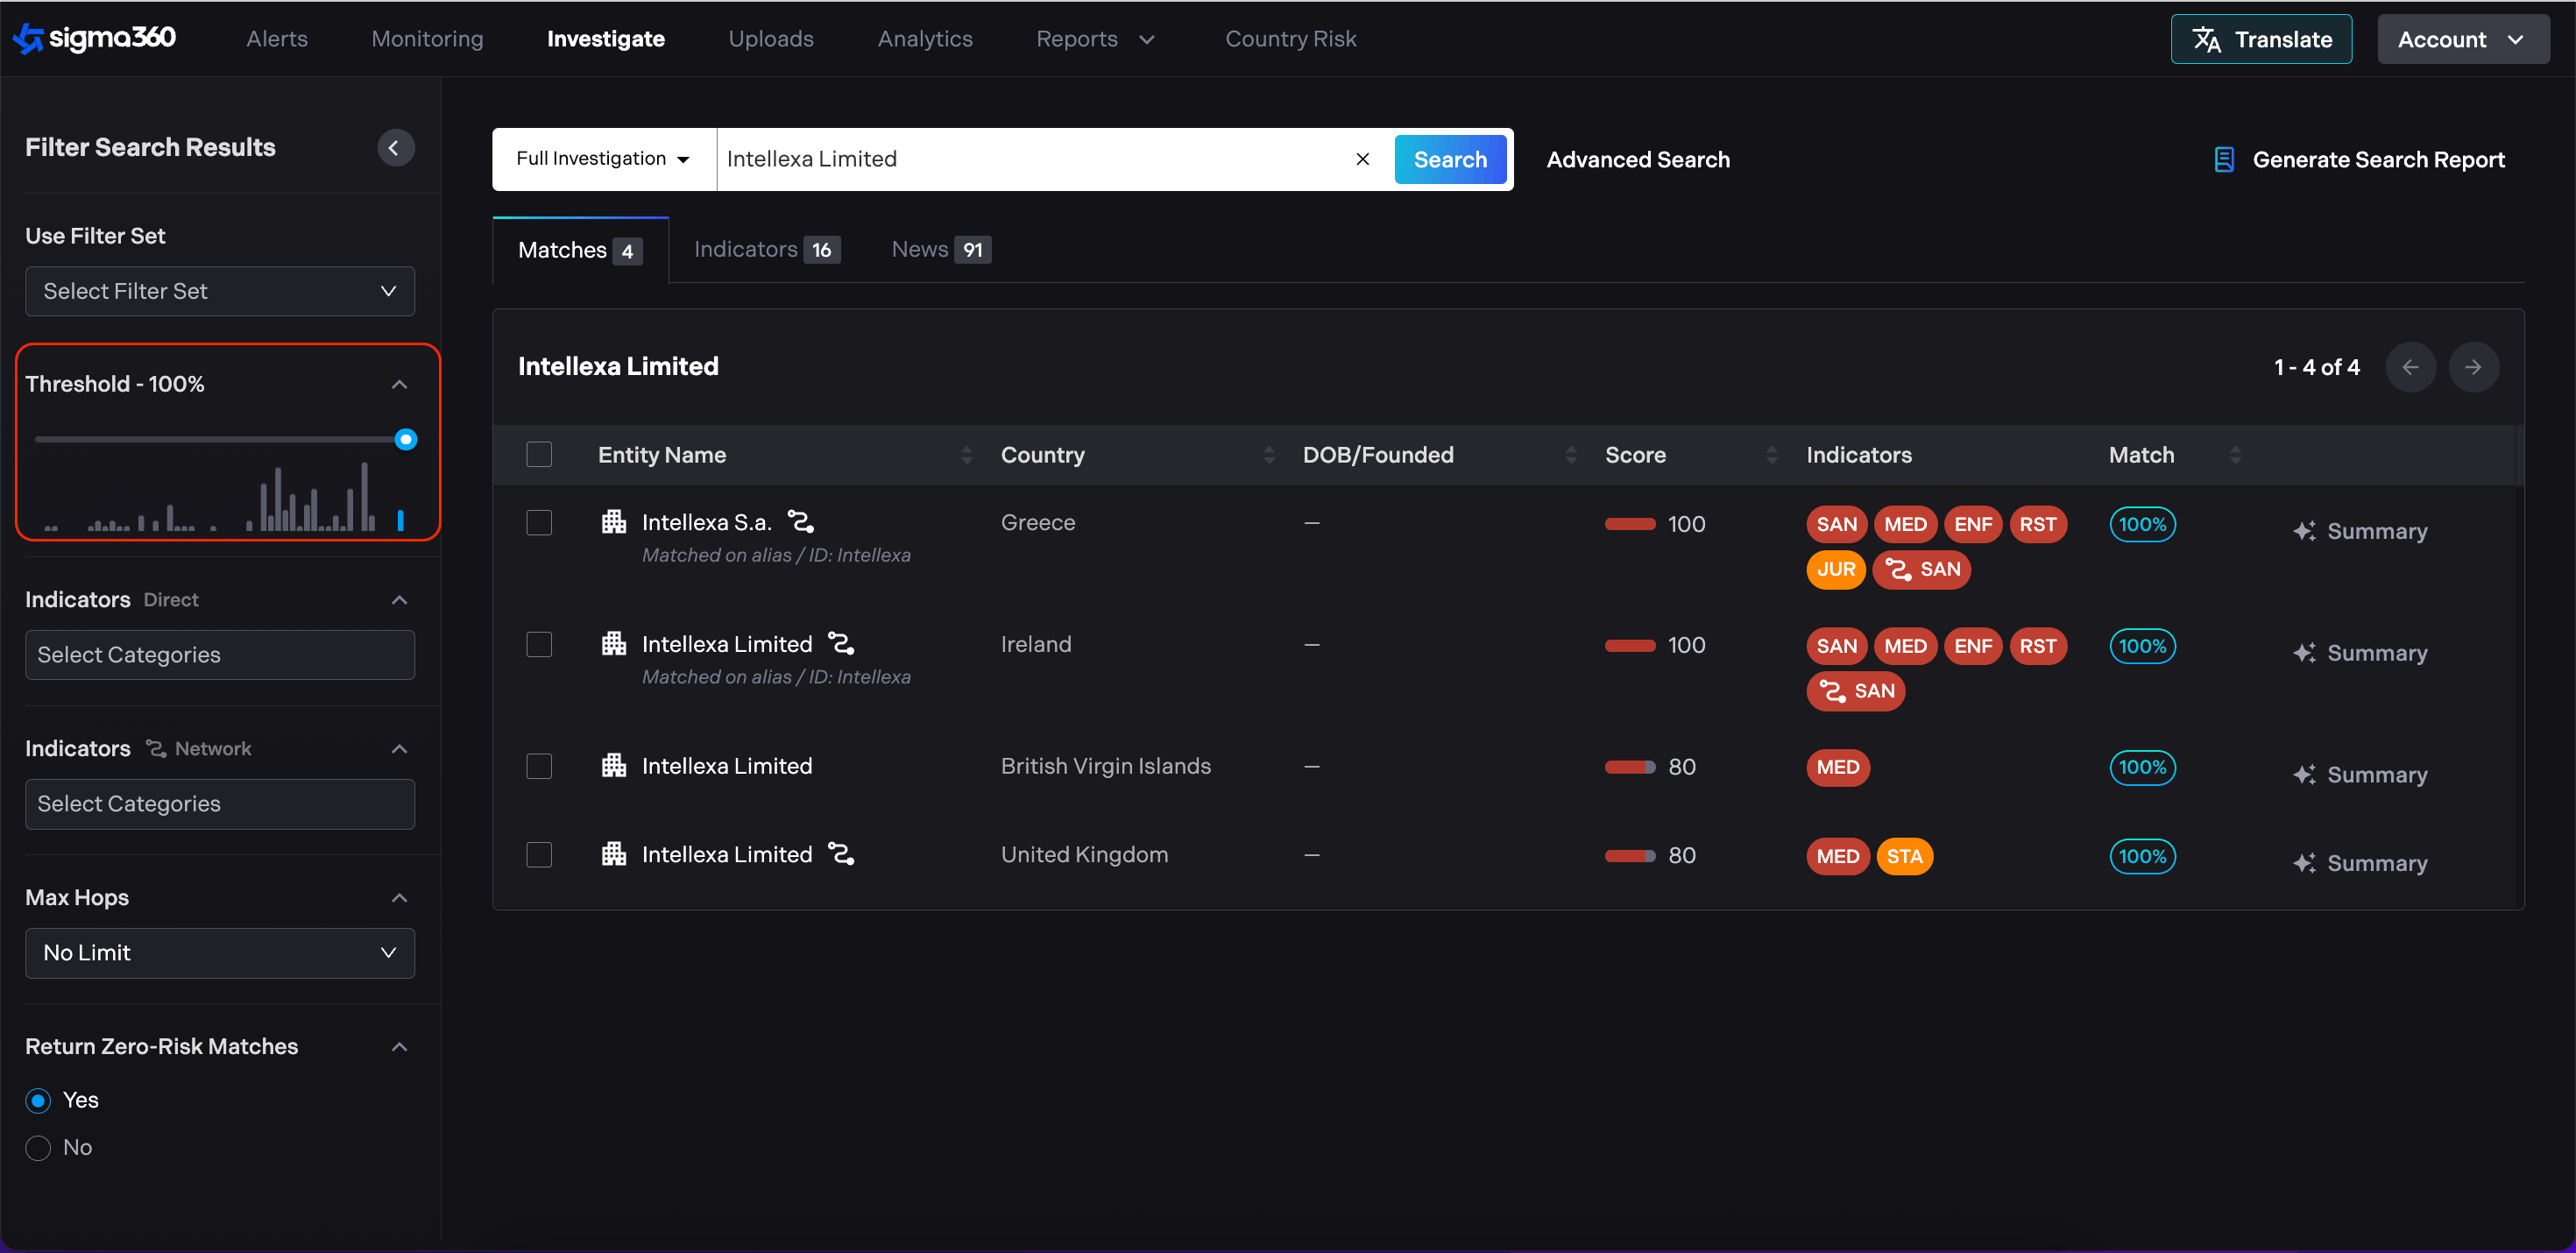
Threshold - Select a match threshold via the slider. A lower threshold results in a larger volume of results and wider scan of data, while a higher threshold returns more precise results. Default is set to 95%, minimum is set to 50%. Threshold displays 1% intervals relative to the results that would fall into each threshold band.
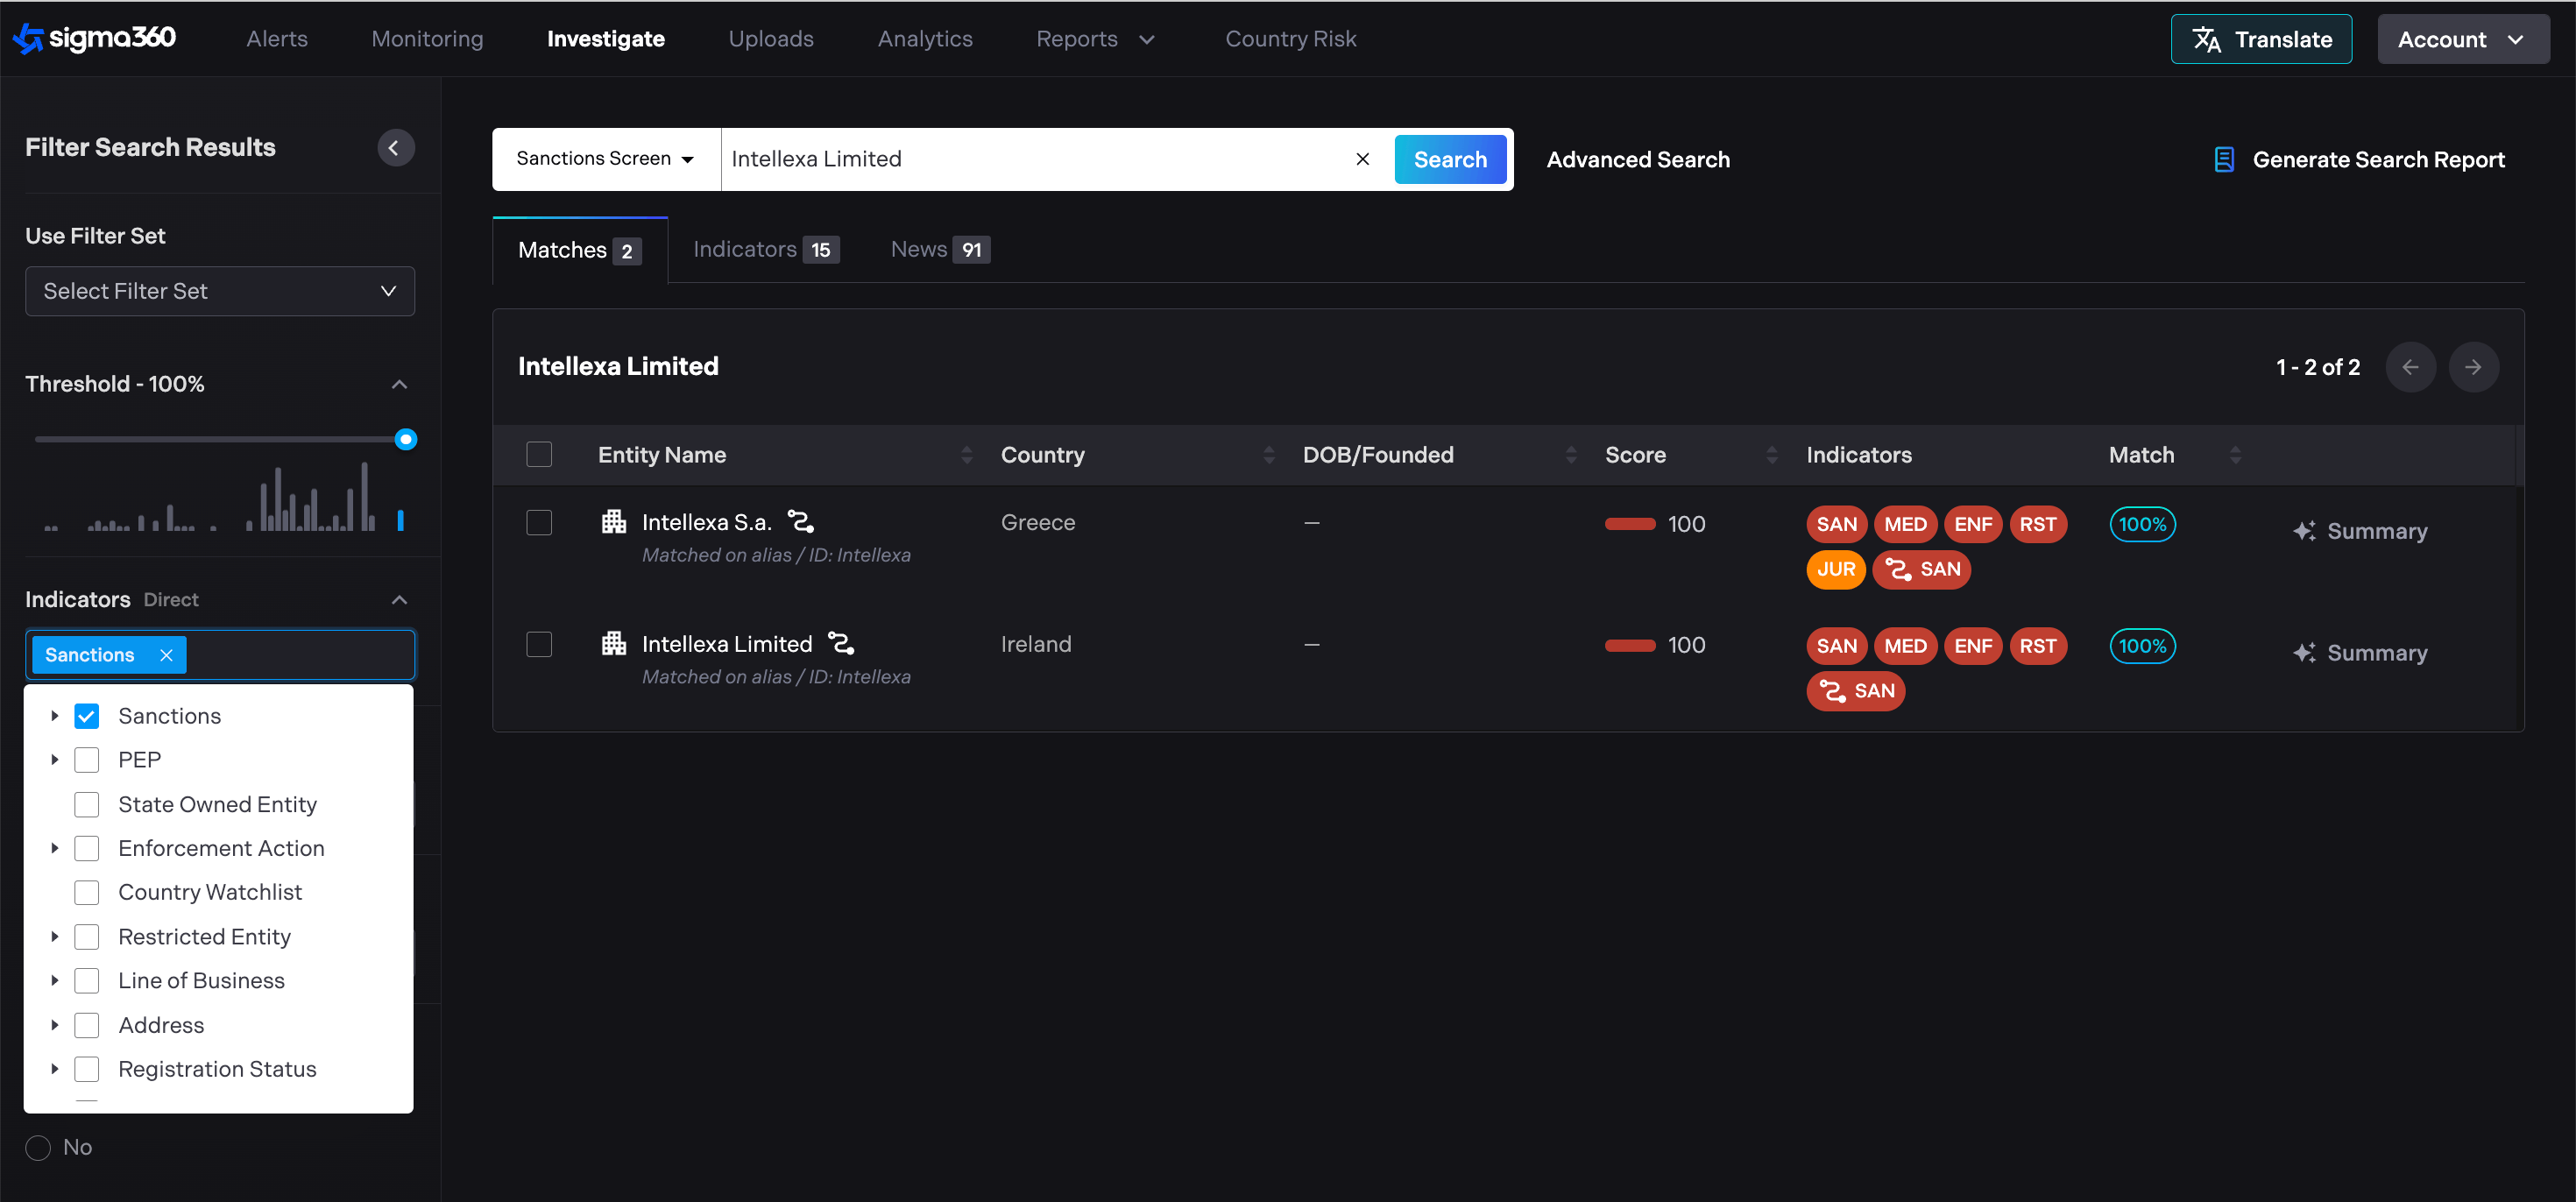
Indicators (Optional) - Search results are displayed in a format which is organized by Sigma indicator (e.g. PEP classification/ associations, Sanctions, Adverse Media). Select desired indicators to filter results. Default is set to all.
Once all desired filters are selected and Entity details input to the search bar, press the Enter key to generate results.
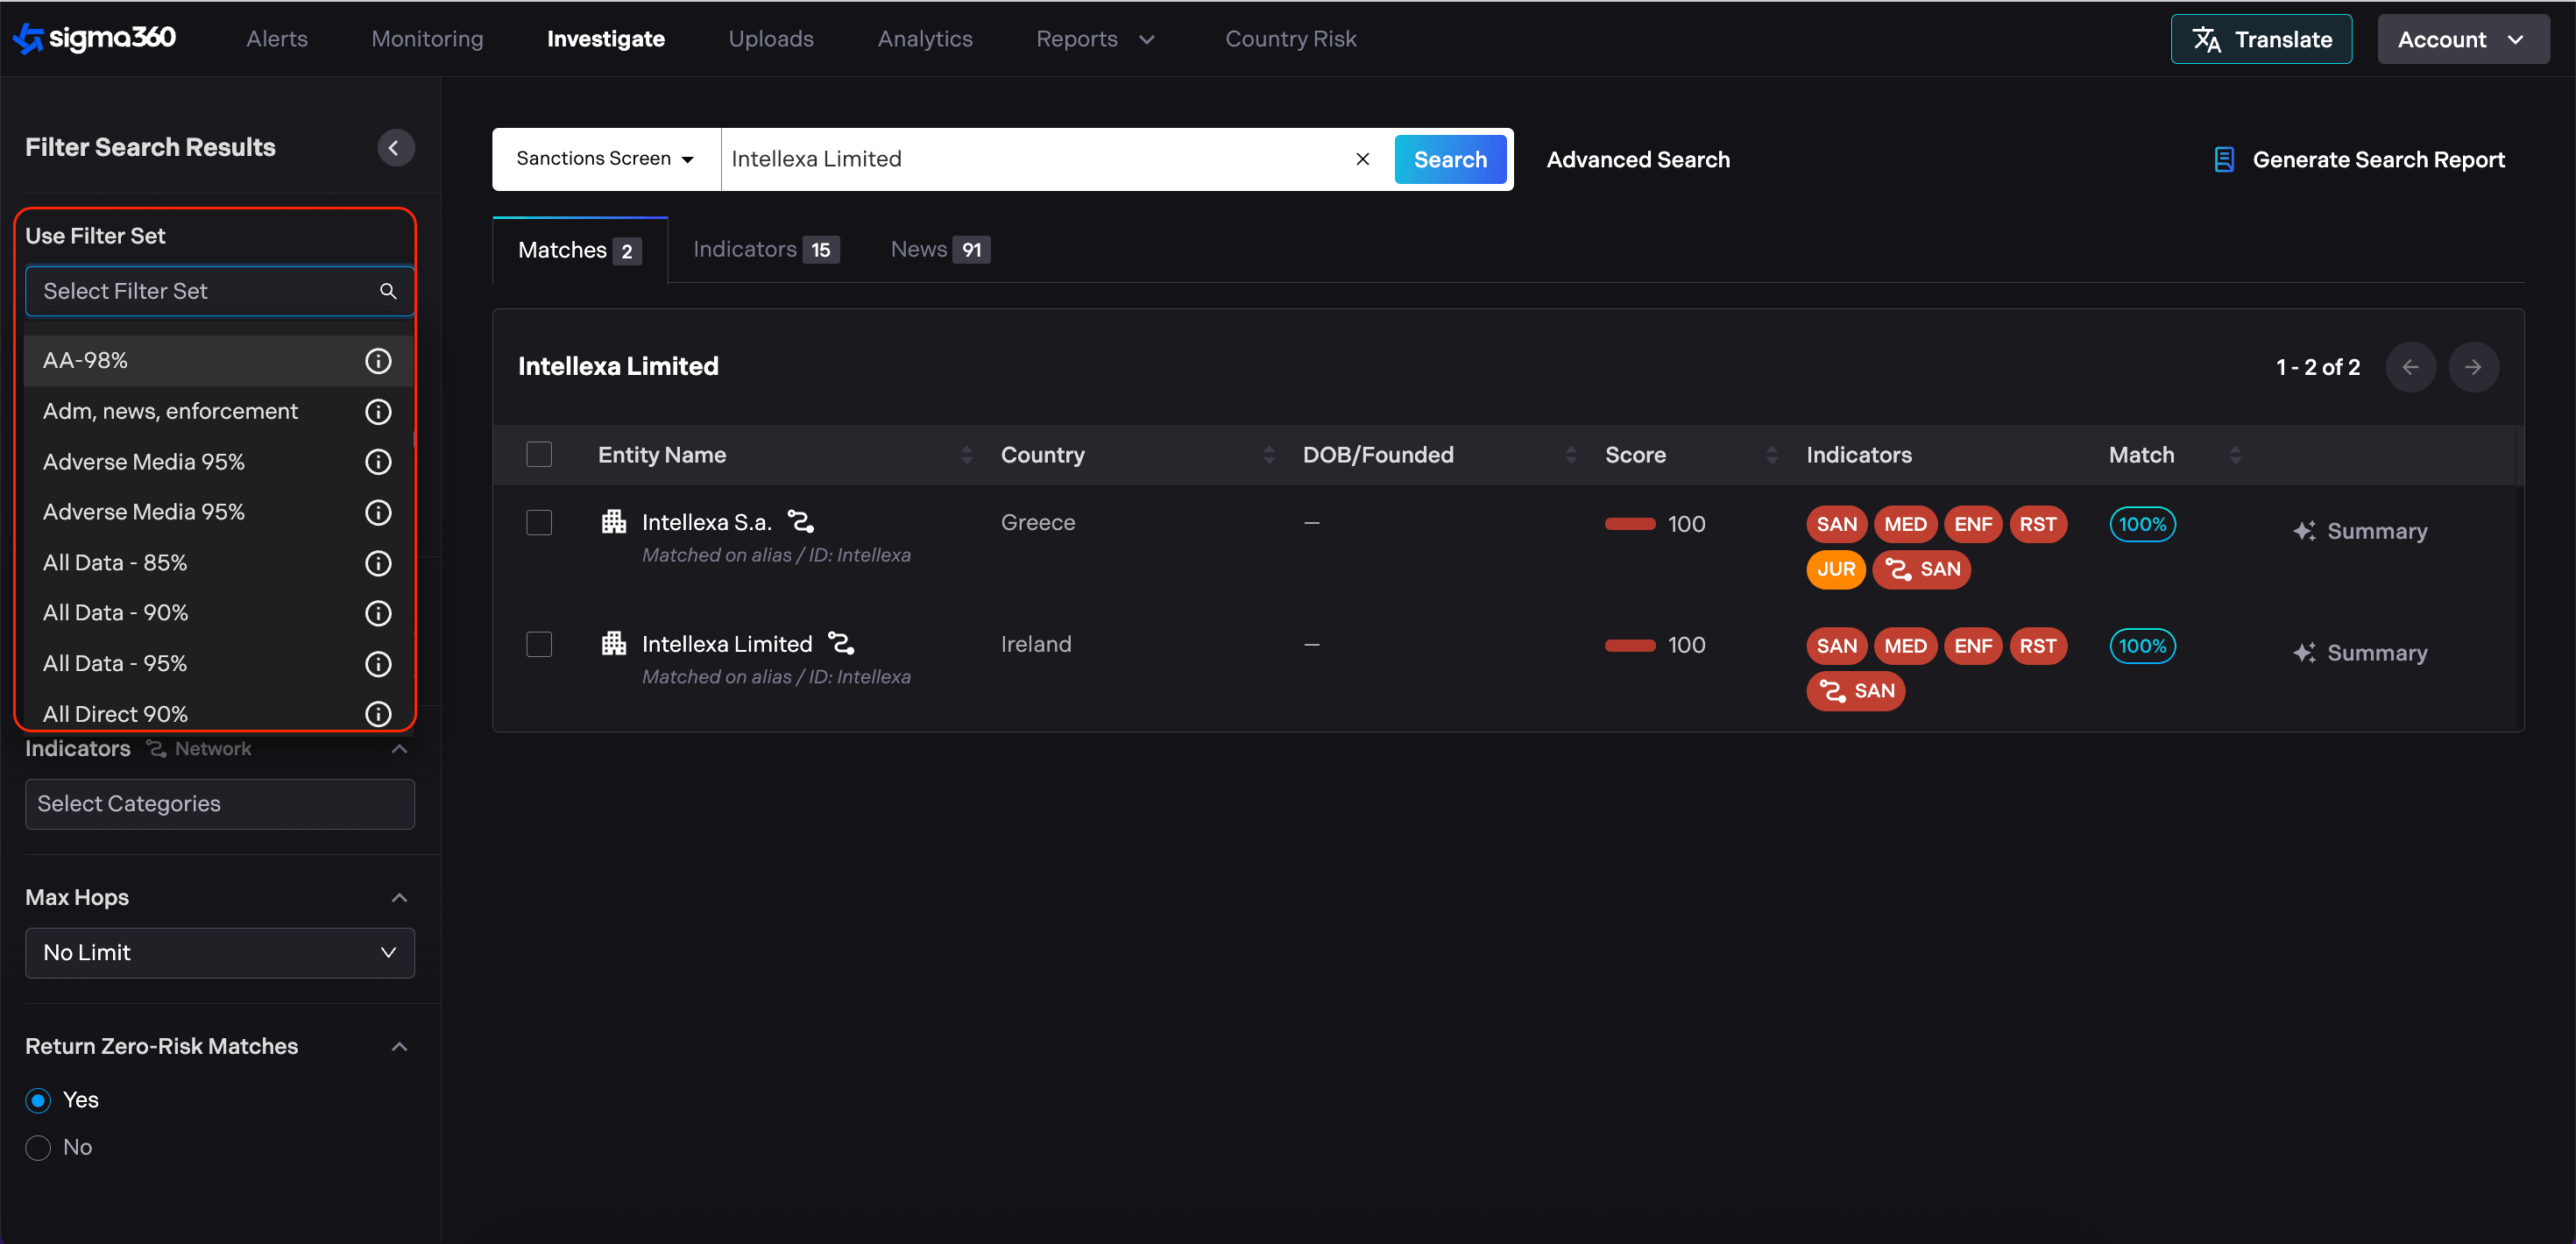
Search filtering aligns with the functionality found in Monitoring, while also allowing users to filter on pre-defined filter sets.
Performing Optimal Searches using Sigma360 Investigate
Sigma360 runs user's search term - by default - against key attributes in Sigma360 database (name, address, date of birth, etc.). It is important to be as precise as possible when running a search using Investigate. Of course, Sigma360 provides the ability to be less conservative in user's search via match threshold (see above), nonetheless, precision helps guide more successful inquiries.
Keep in mind the following:
-
Sigma360 runs the search terms user entered against the names of the primary Entities in Sigma360's database.
-
Users will get the best result if exact names are entered for a search.
-
If a user does not know the exact name, try a unique aspect of the name instead.
-
The match percentage returned takes in account typical corporate prefixes and suffixes.
-
Users should use filters to help narrow returns (e.g., person or corporate).
-
Because Sigma360 limits the number of results only to those that meet the match threshold, users may need to try other variations of the name if a return is not immediately found.
Results review
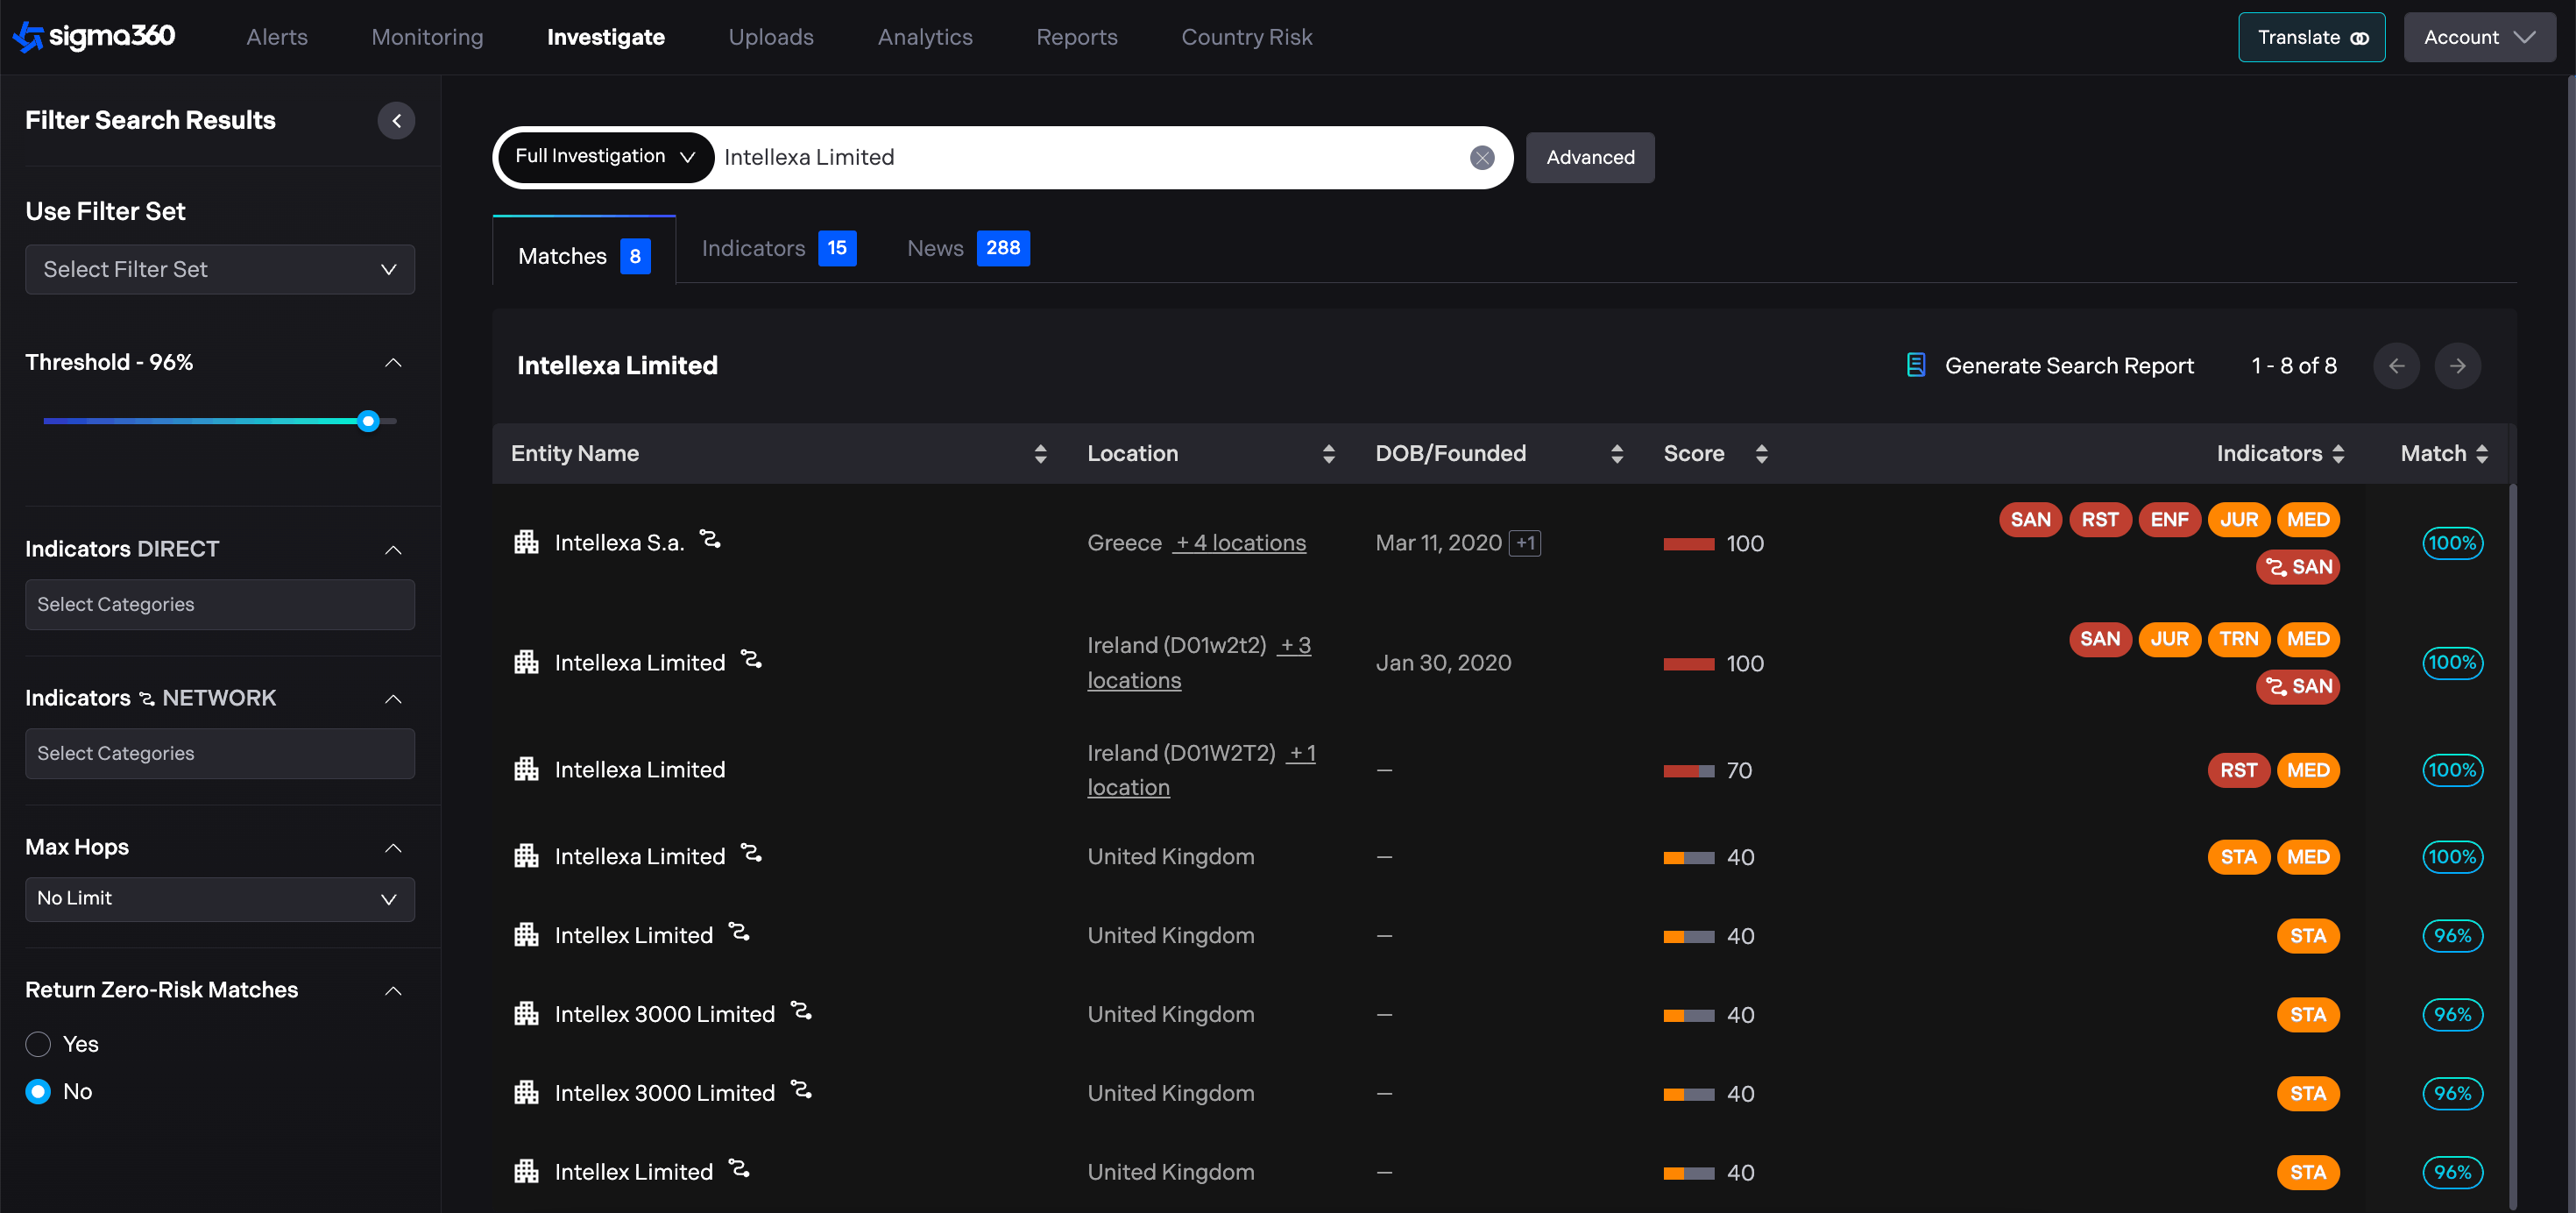
Results are displayed as follows. Depending on filters, matched results from data sources, and threshold, multiple Entity results may appear. The icon to the left of each result indicates the Entity type (company or natural person) of the result.
Various filters may be applied to search results, to order the display of the results page in accordance with desired characteristics or ratings (e.g 'Entity Name' filter to order in alphabetical or reverse alphabetical order, or 'Match' filter to order in terms of highest-to-lowest or lowest-to-highest name percentage match). To order results according to a desired characteristic or rating, select either the up or down arrow next to the characteristic or rating. The following image shows the results page when the 'Match' percentage filter is set to highest-to-lowest ordering:
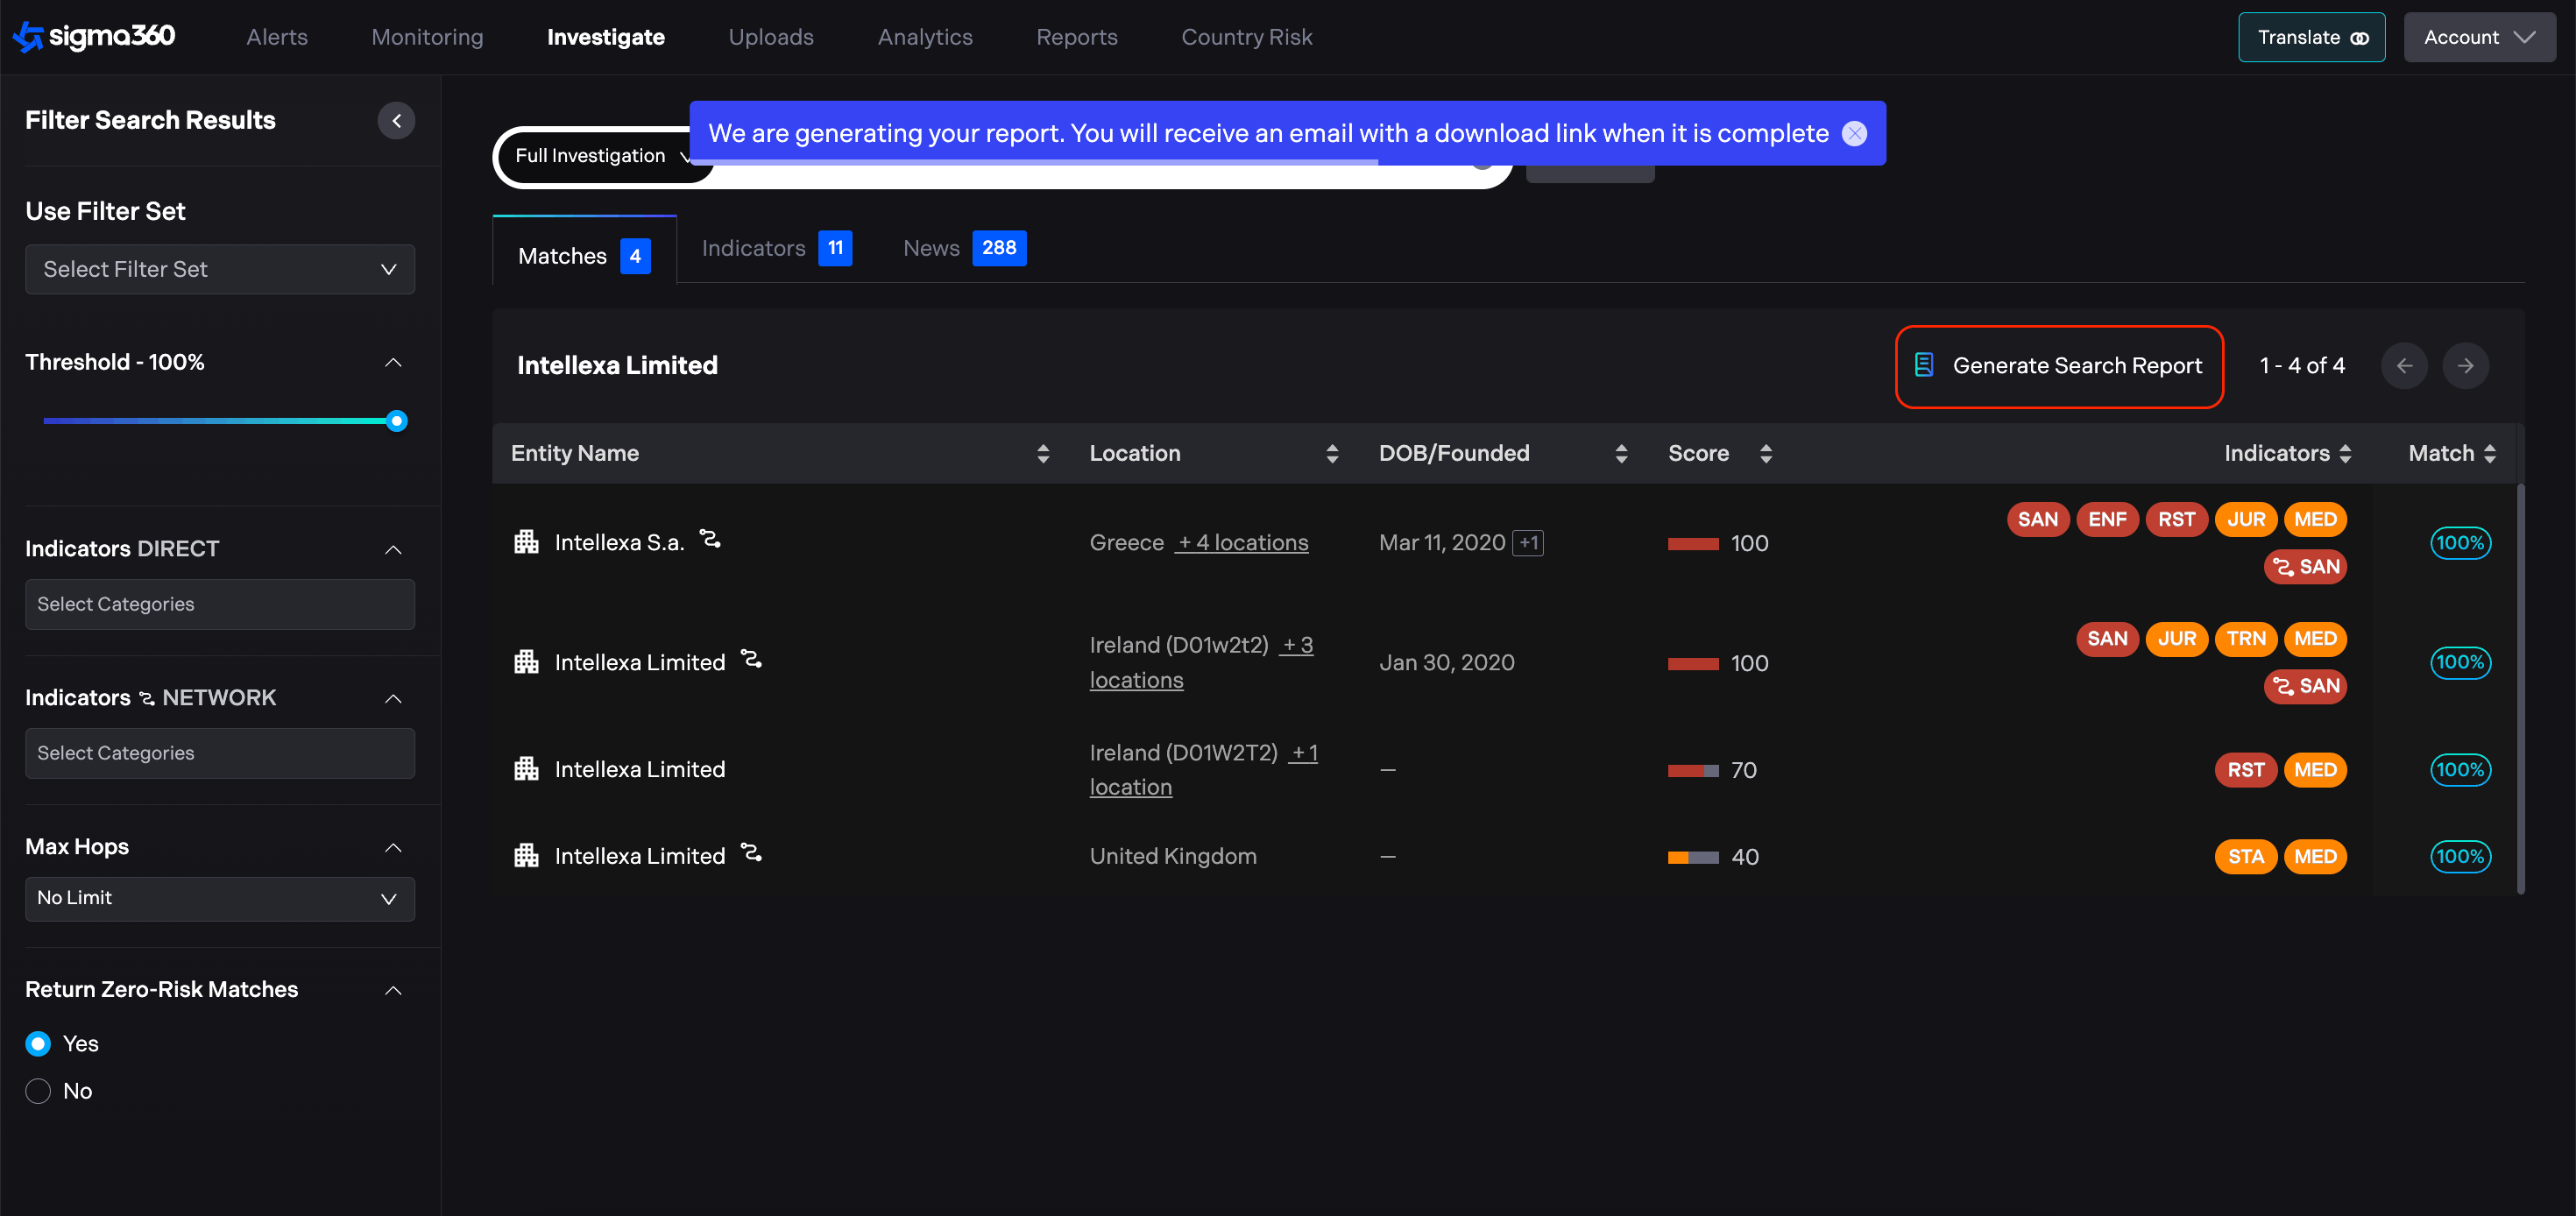
Creating a PDF Report for Data Extraction
There is an option to create a PDF report containing details of your search. In order to generate a report, users should click the "Generate Search Report" button. The relevant report will be delivered to the email.
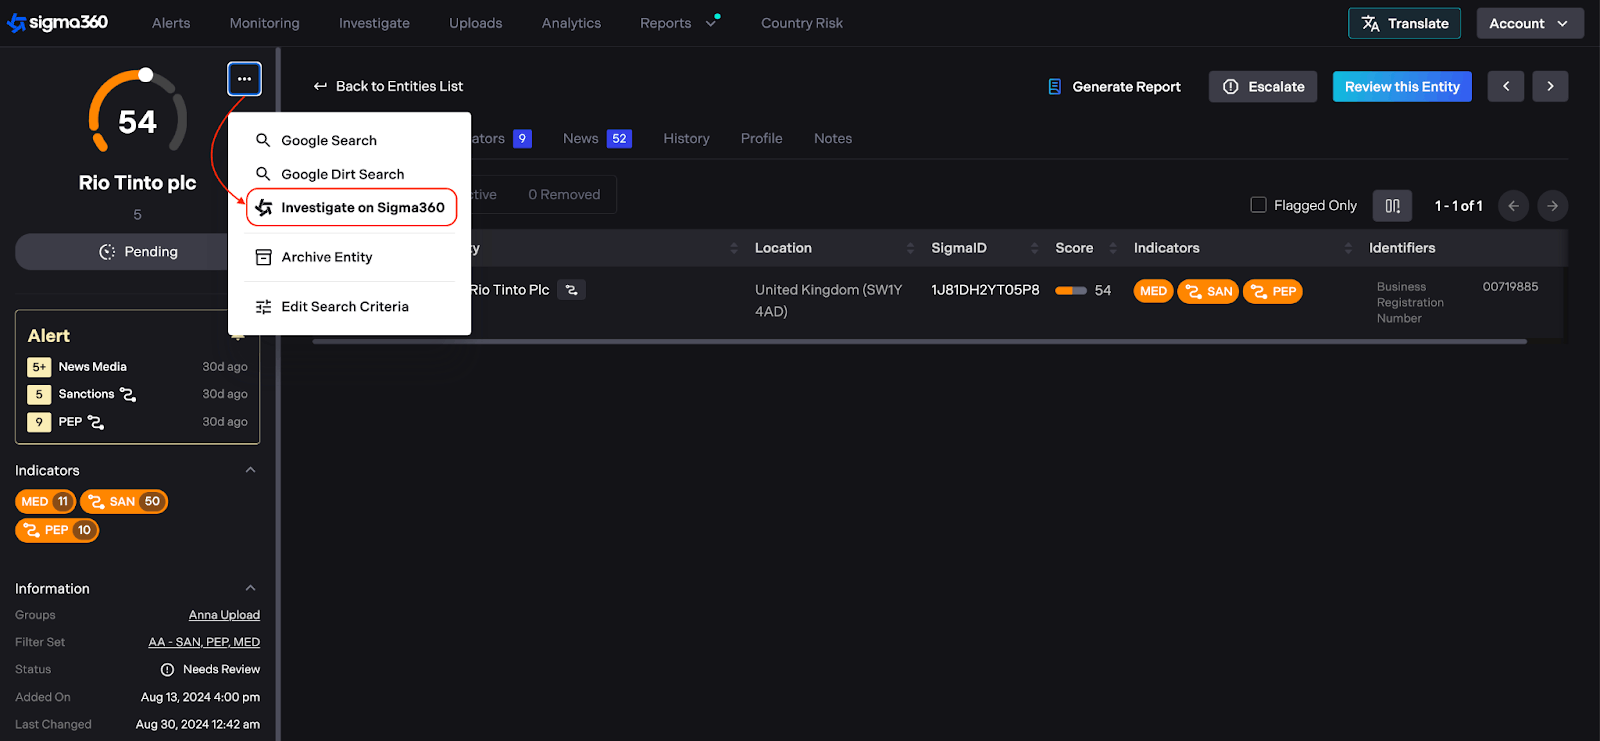
Users can seamlessly investigate a monitored entity without the need to copy and paste the name into the Investigate page. By selecting the "Investigate on Sigma360" option from the entity's dropdown menu, users are redirected to the Investigate page with the entity's name prefilled in the search bar. This allows for a deeper investigation by viewing the entity without the applied filter set.
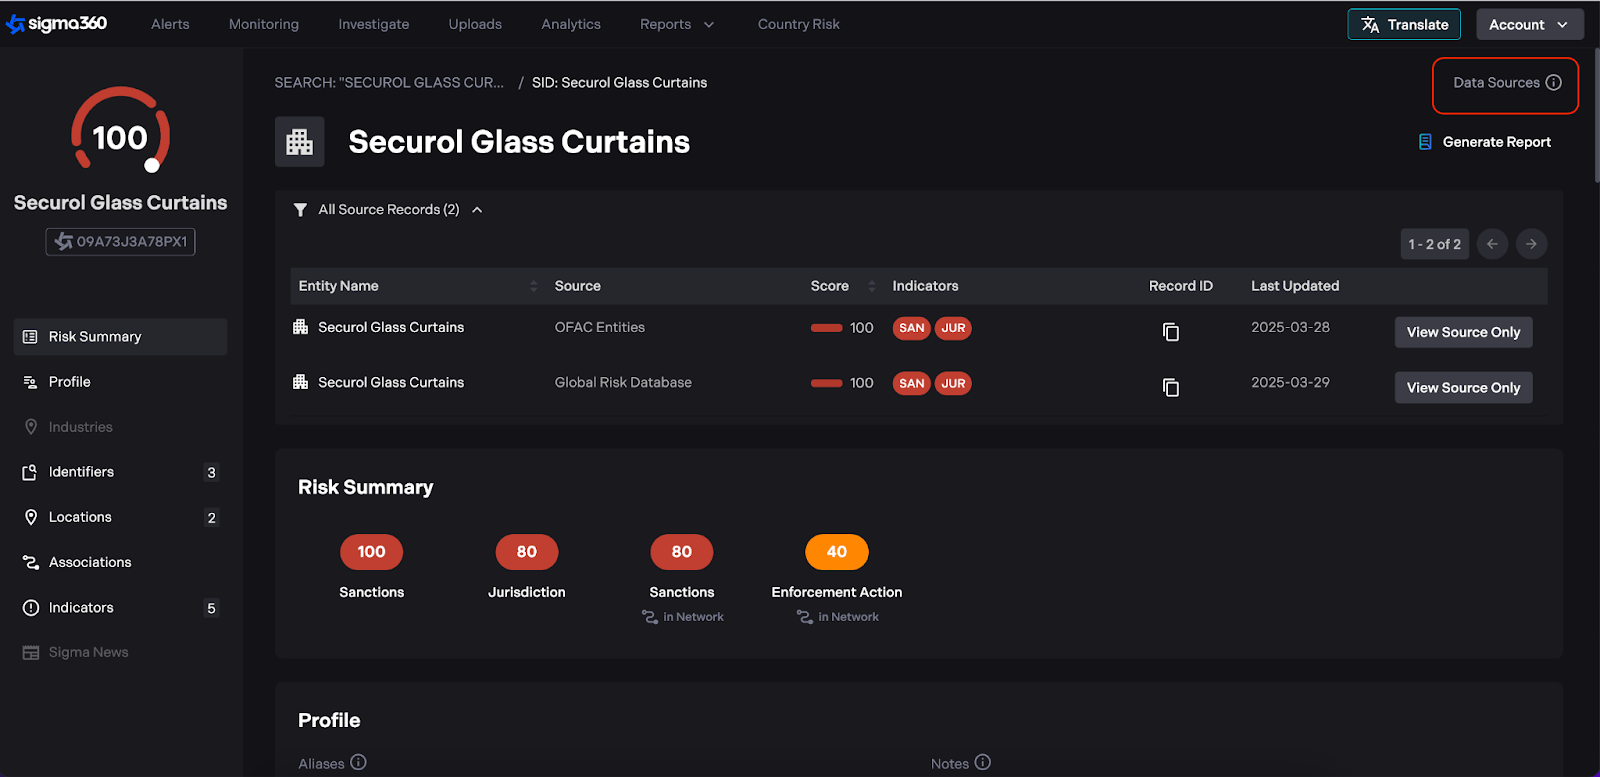
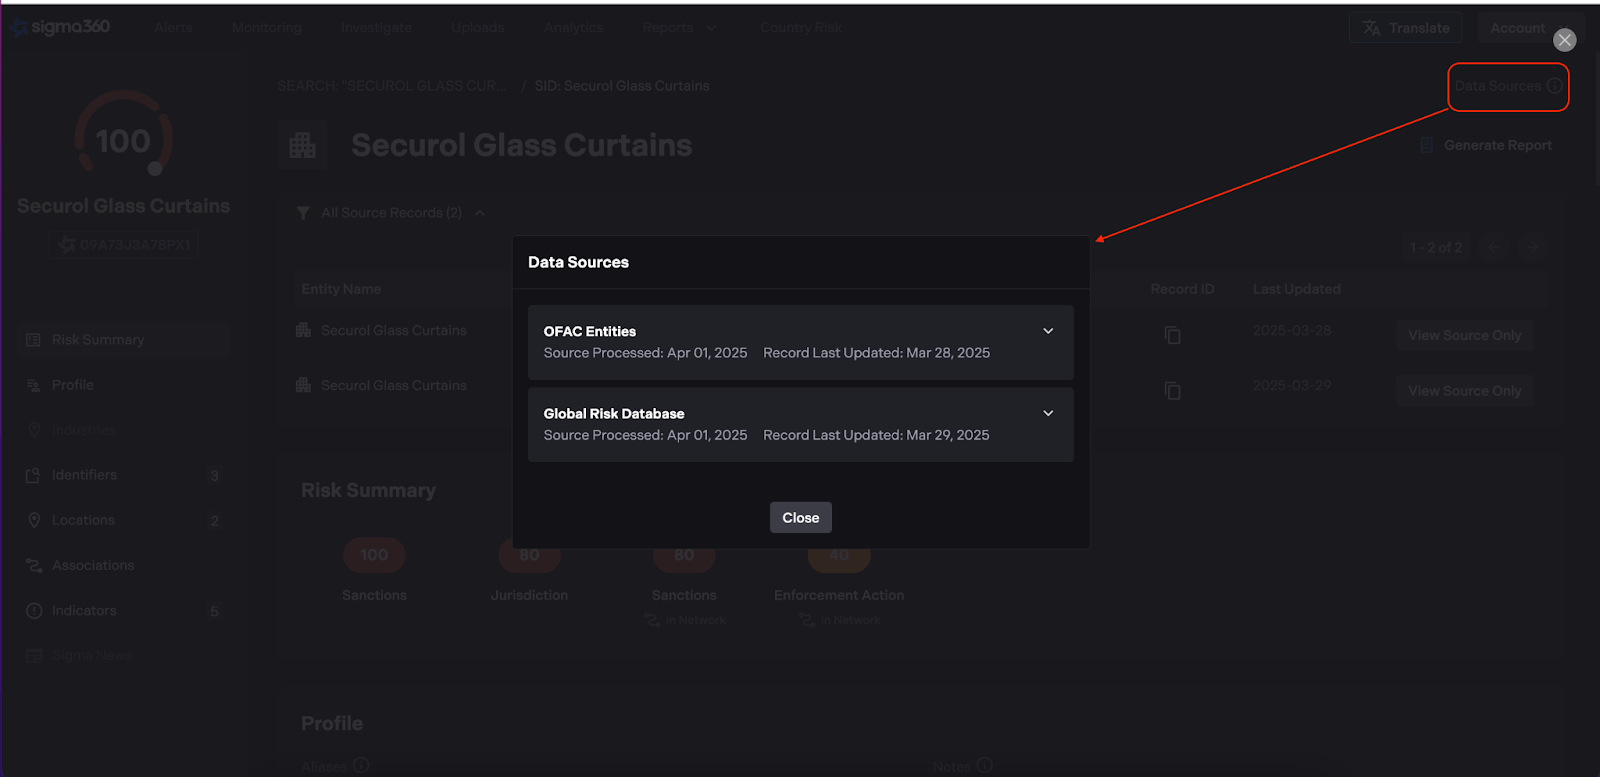
Source Attribution
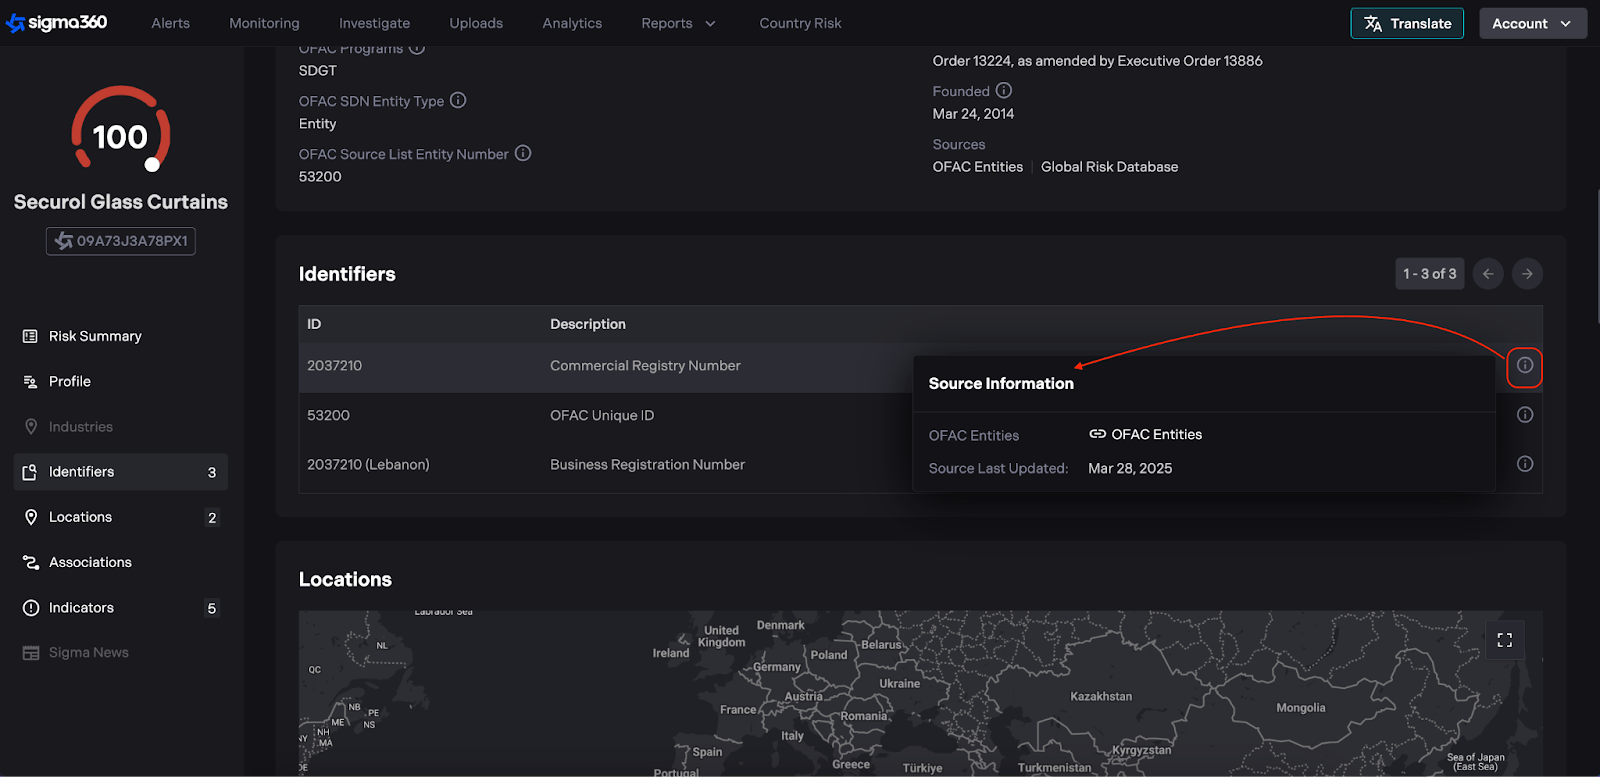
To enhance data transparency, the Source attribution will be displayed across key data points, including Profile Data, Aliases, Locations, Political Positions, Identifiers, and Indicators**.**
-
Source Name – The origin of the data.
-
Source Link – A direct link to the source (when available).
-
Date – The date associated with the source (when available).
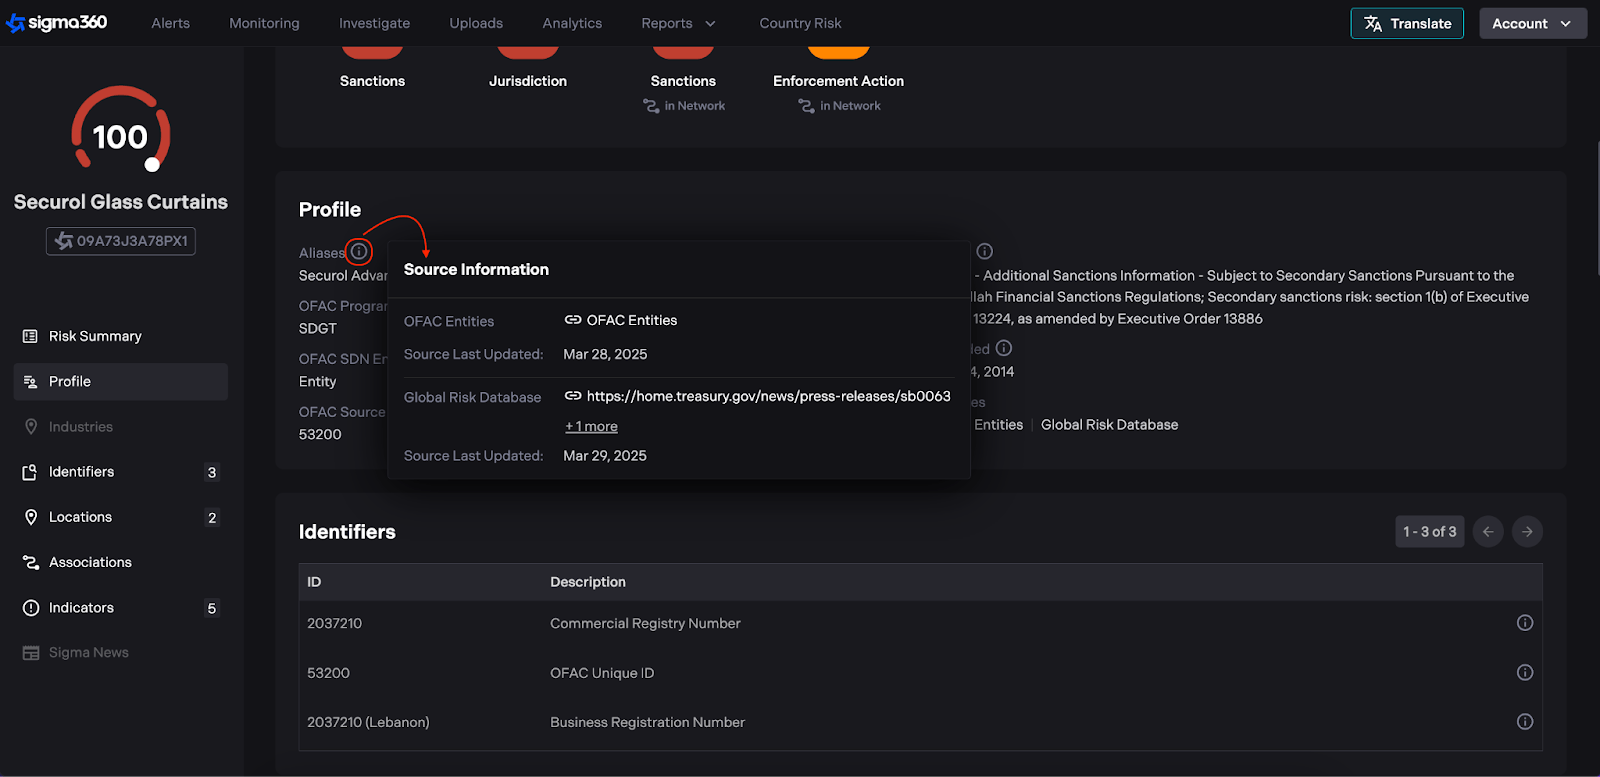
In the source attribution popup, two key timestamps for each source will be displayed:
-
Source Processed Date – The last time Sigma360 processed or checked that particular source for new data.
-
Record Last Updated Date – The last time a change was detected in this specific record.
Network Graph
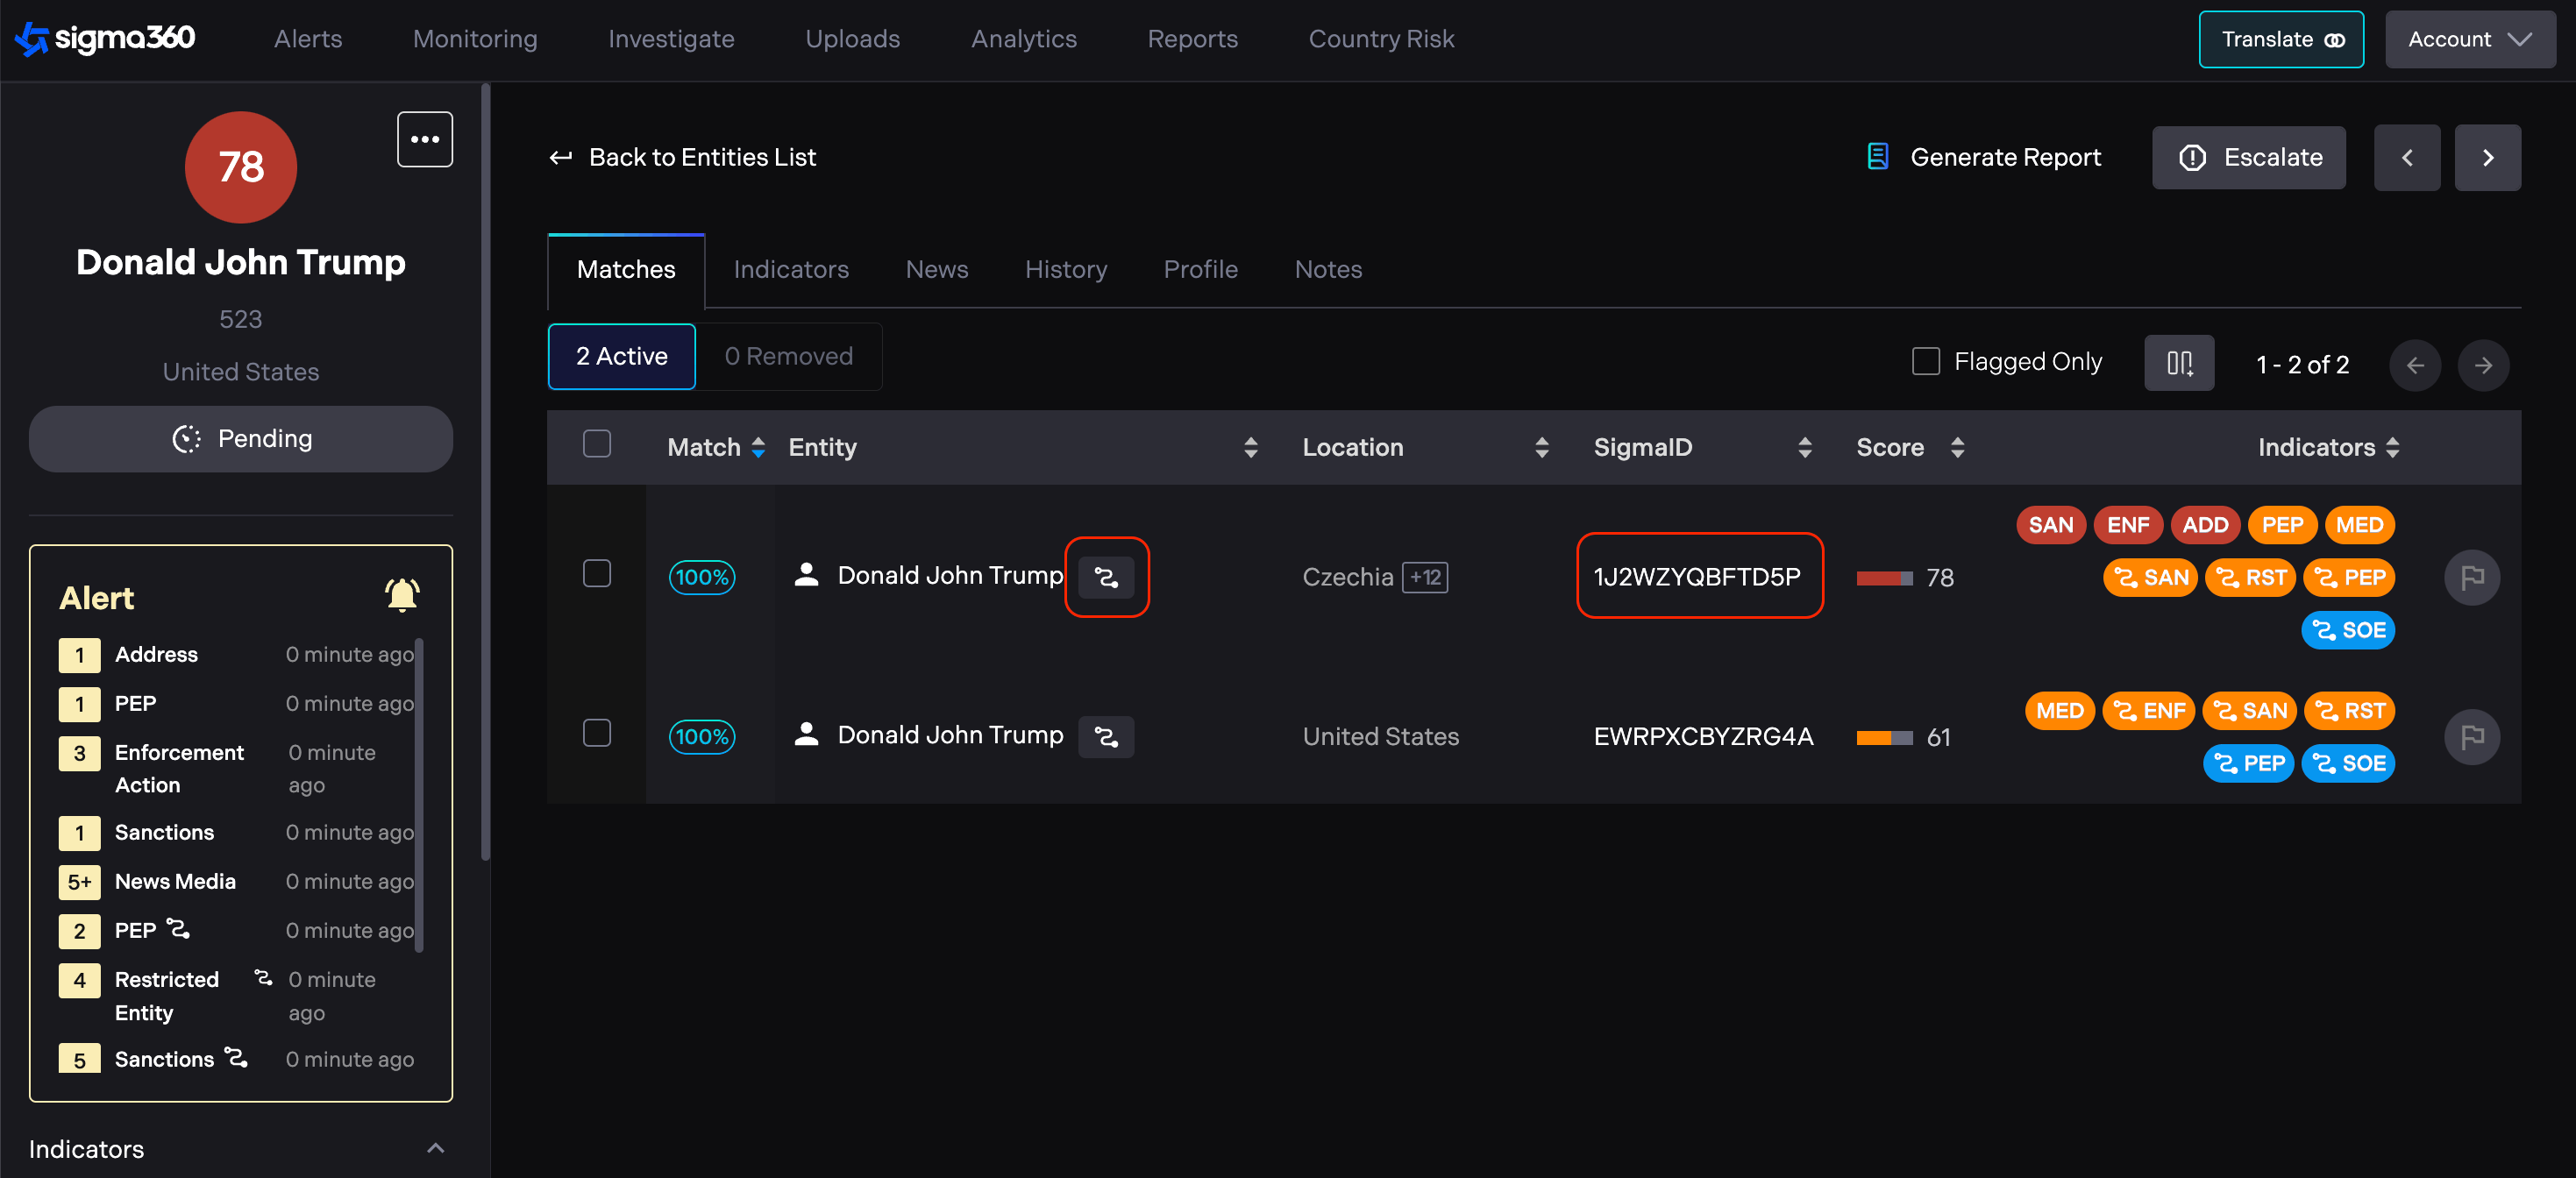
Graph is a visualization and interaction tool that enables users or investigators to explore the network of associations for a given entity. The graph is configured to show a maximum of 50 nodes, prioritizing ownership relationships and relationships that link to risky nodes (sanctions, peps, enforcements, restricted, etc.). The graph links together the associations from all sources that carry association data. A benefit of the Sigma360 entity resolution process is that associations are resolved.
Users can access the graph from the Matches tab if the Match displays an "associations icon" indicating the availability of a graph. Additionally, users can navigate directly to the Sigma ID page from the Matches tab.
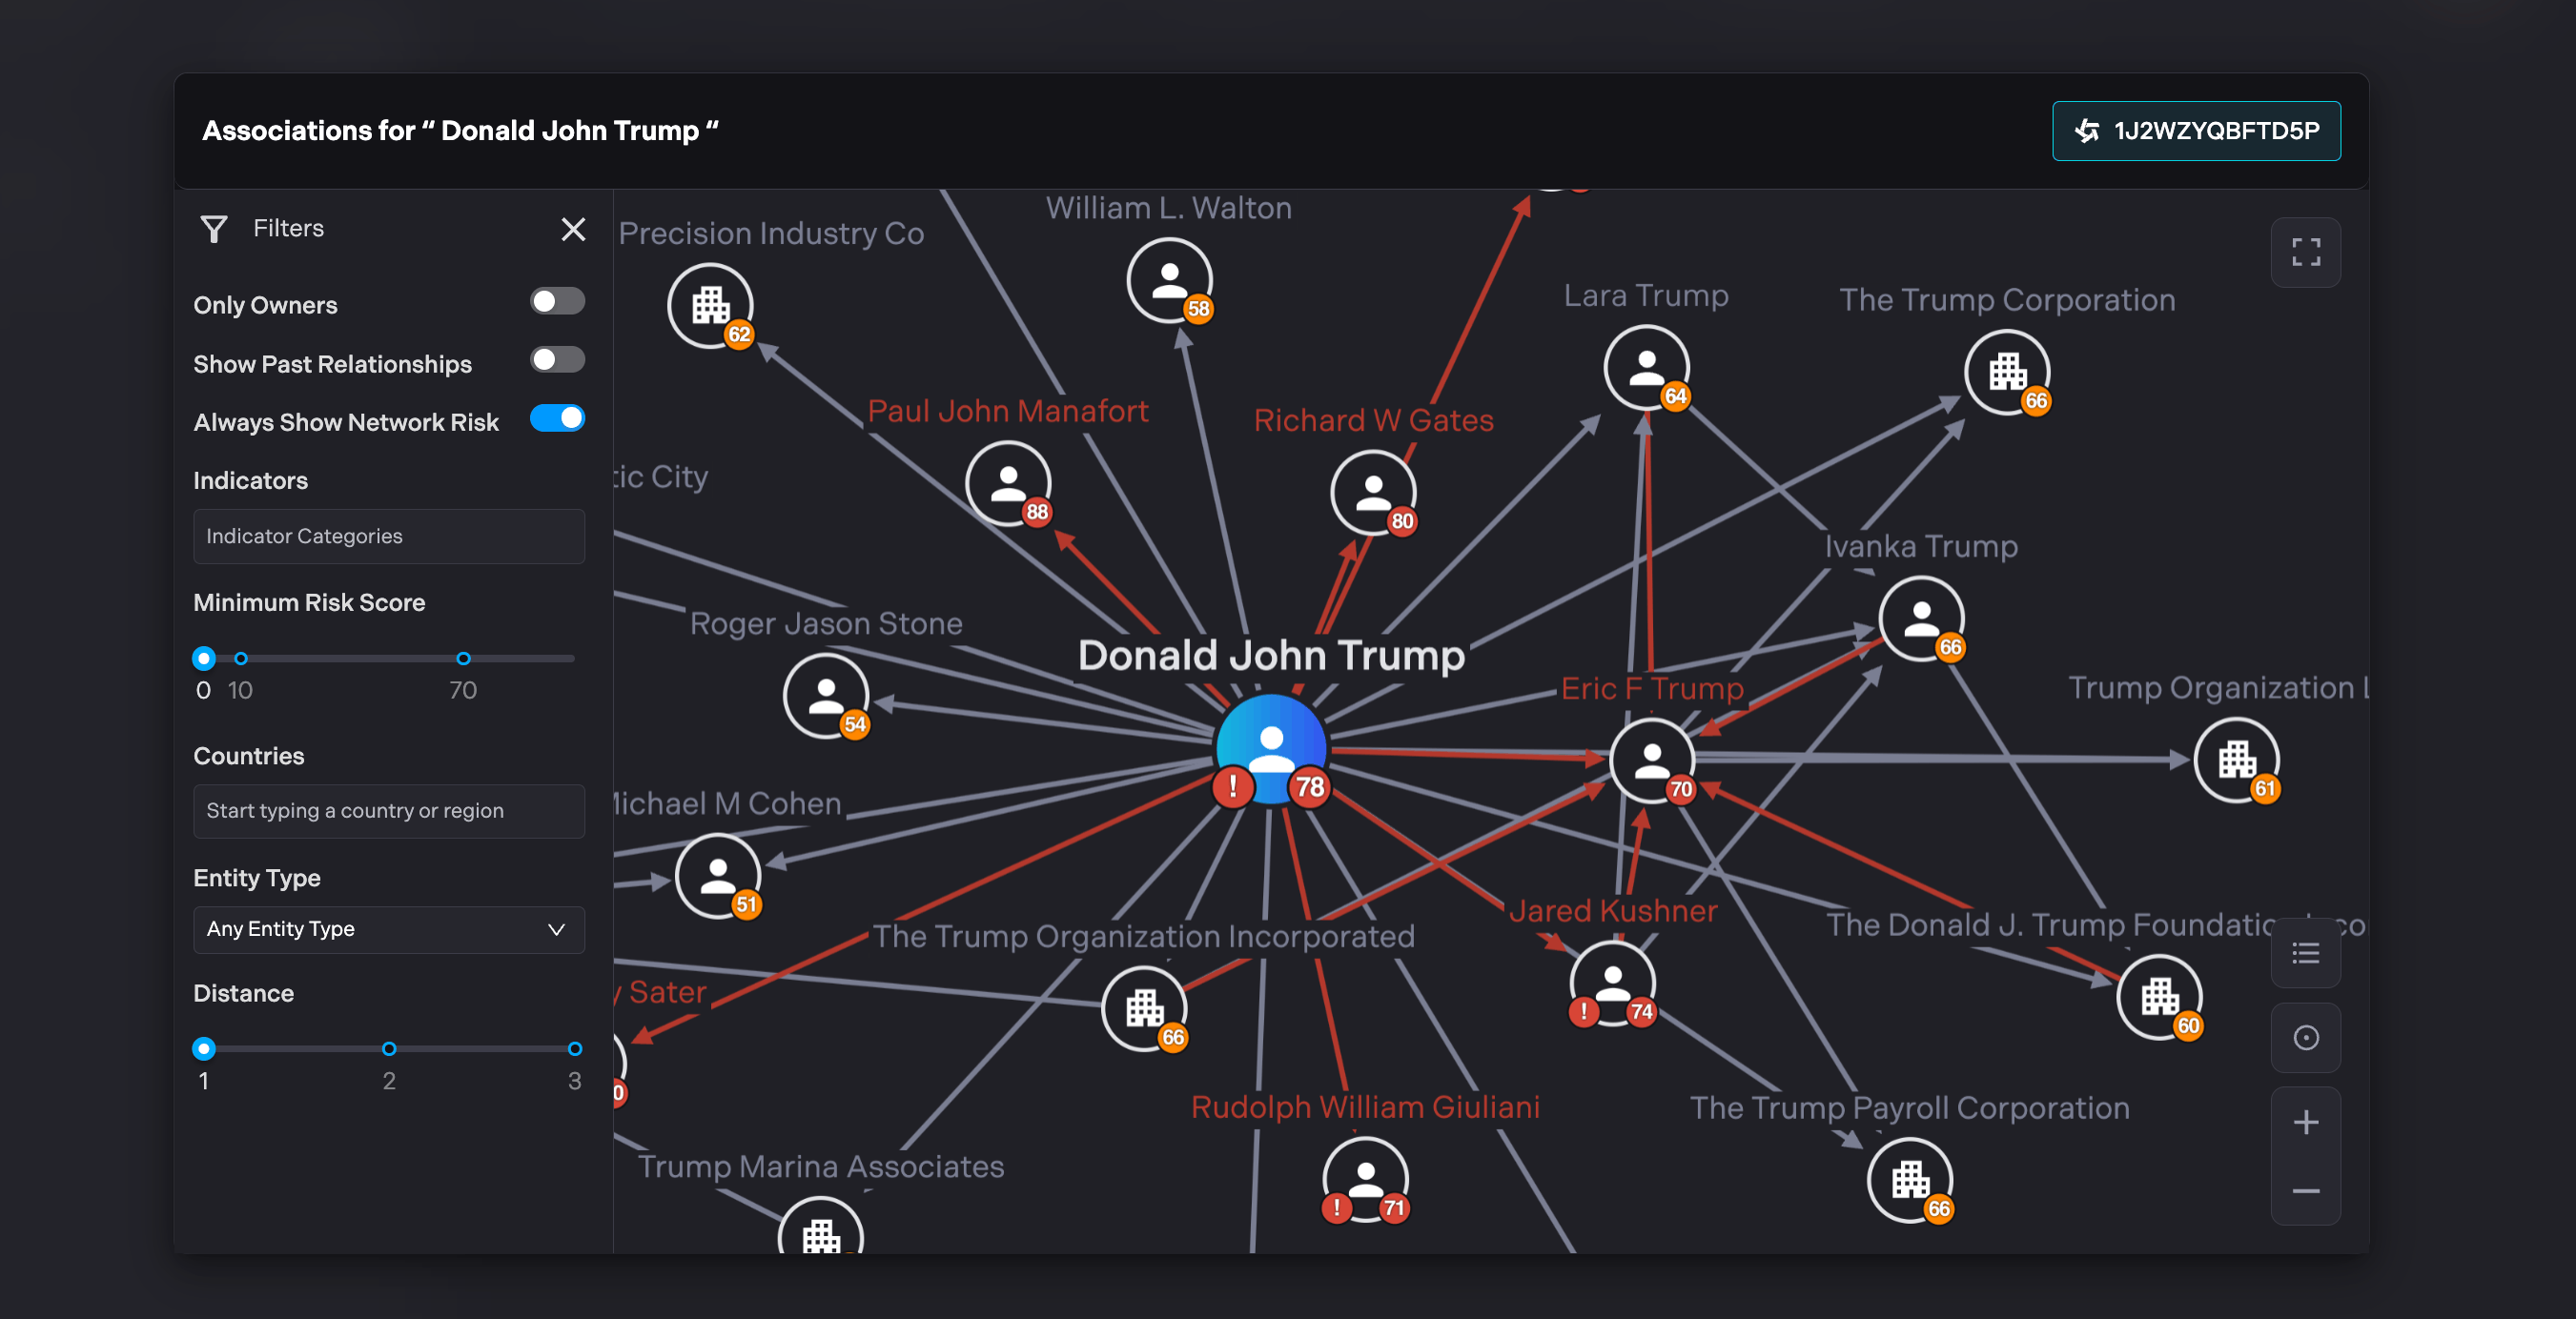
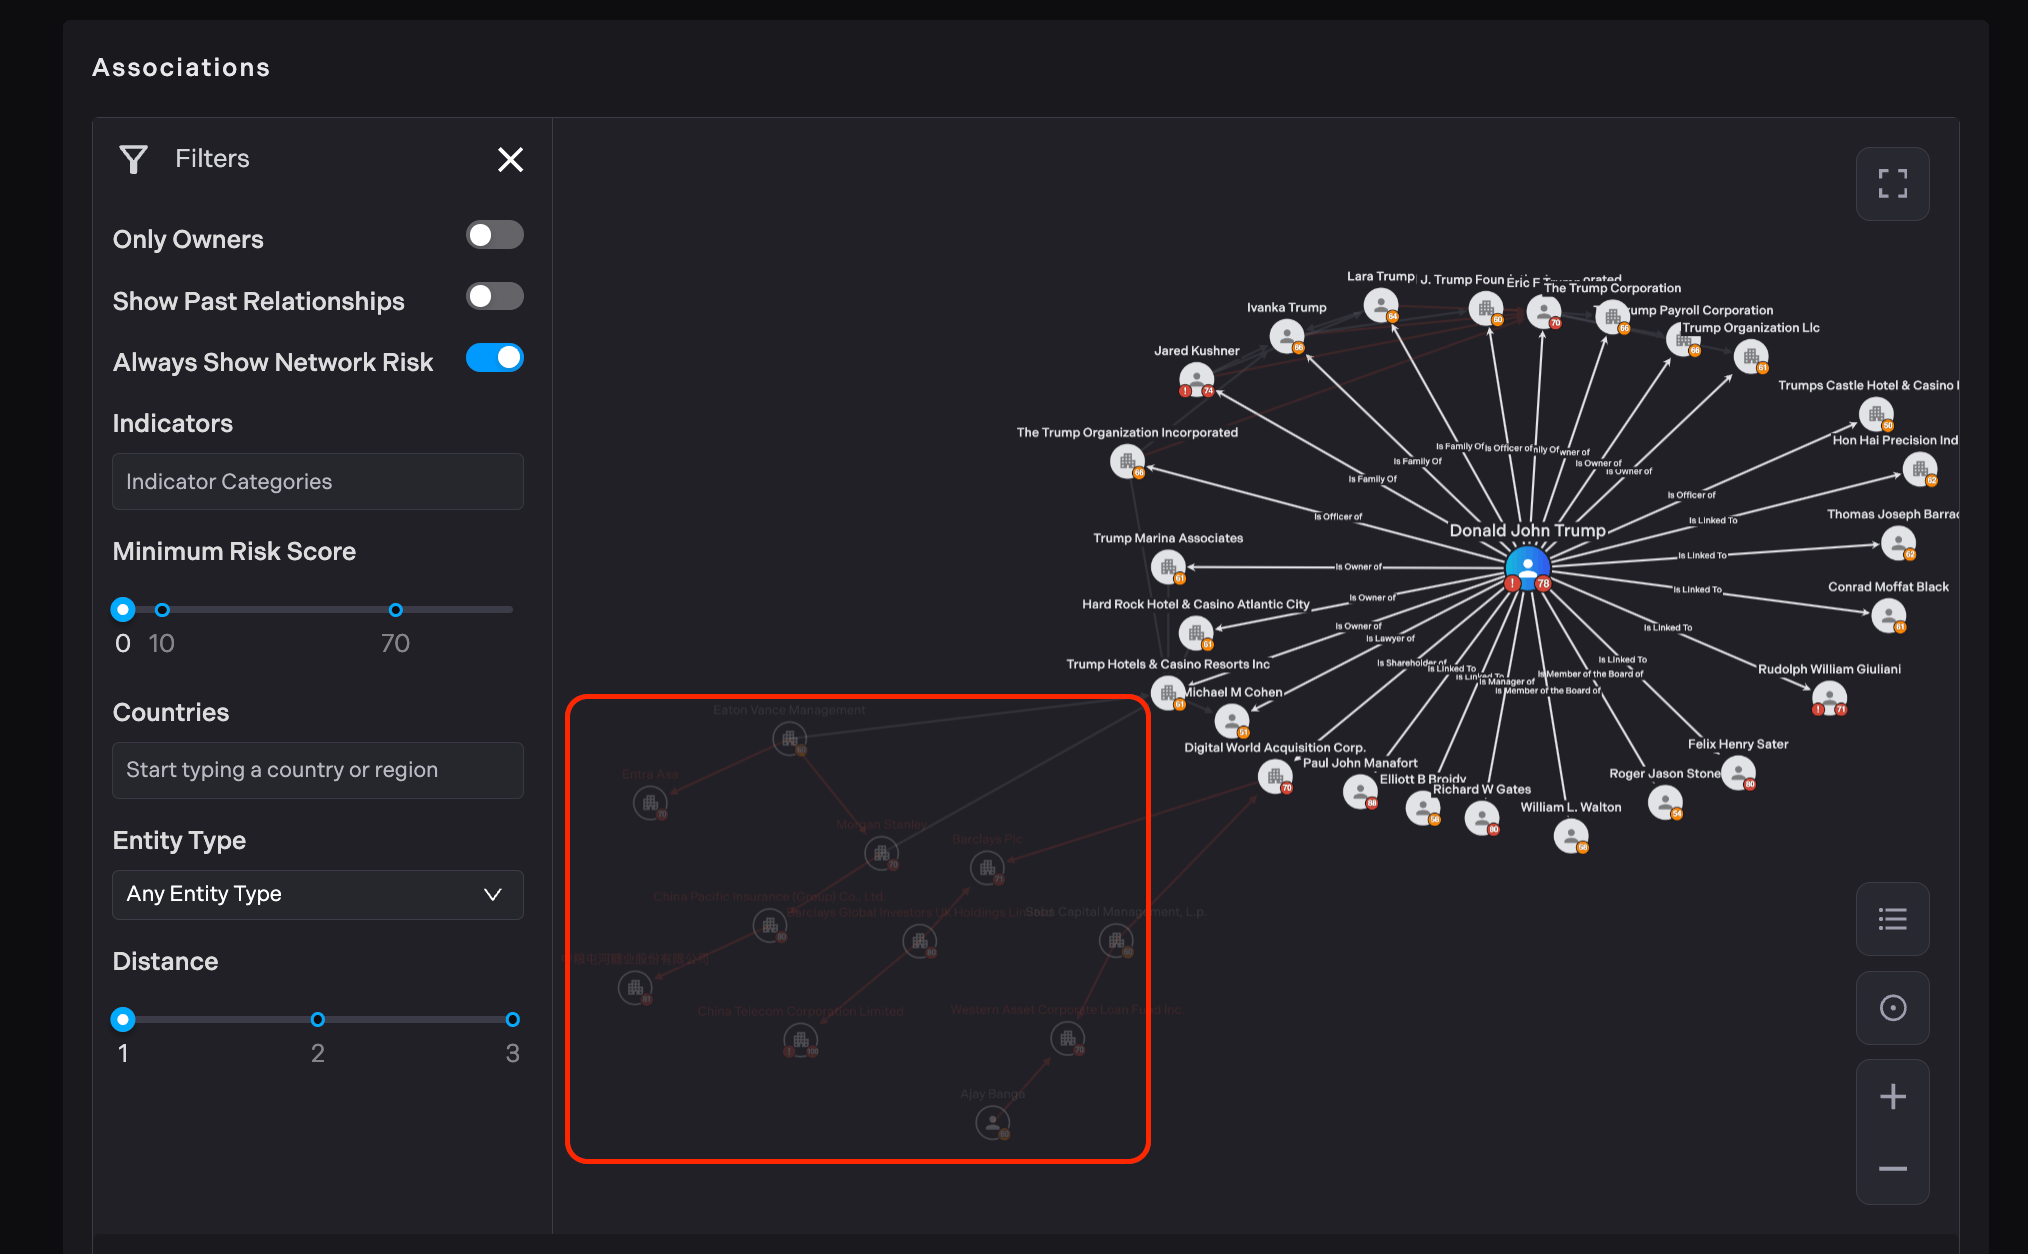
By default, when the graph loads the user is presented with associations, primarily focusing on direct connections (one hop away), while also ensuring that risky paths up to three hops away are always displayed, regardless of any other applied filters.
By toggling the "Always Show Network Risk" option OFF, the graph will remove the highlighted nodes and connections that represent risks or concerning paths within the network.
At the center of the graph, a large blue node represents the focal Sigma ID.
The score for the entity is displayed in the bottom right corner, inside a circle colored to indicate the level of risk
(Red = 70 or above, Yellow-Orange = 10 to 69, Blue = 1-9, Gray = 0). The color system is consistent with the one used for indicator "pills" and scores throughout the platform.
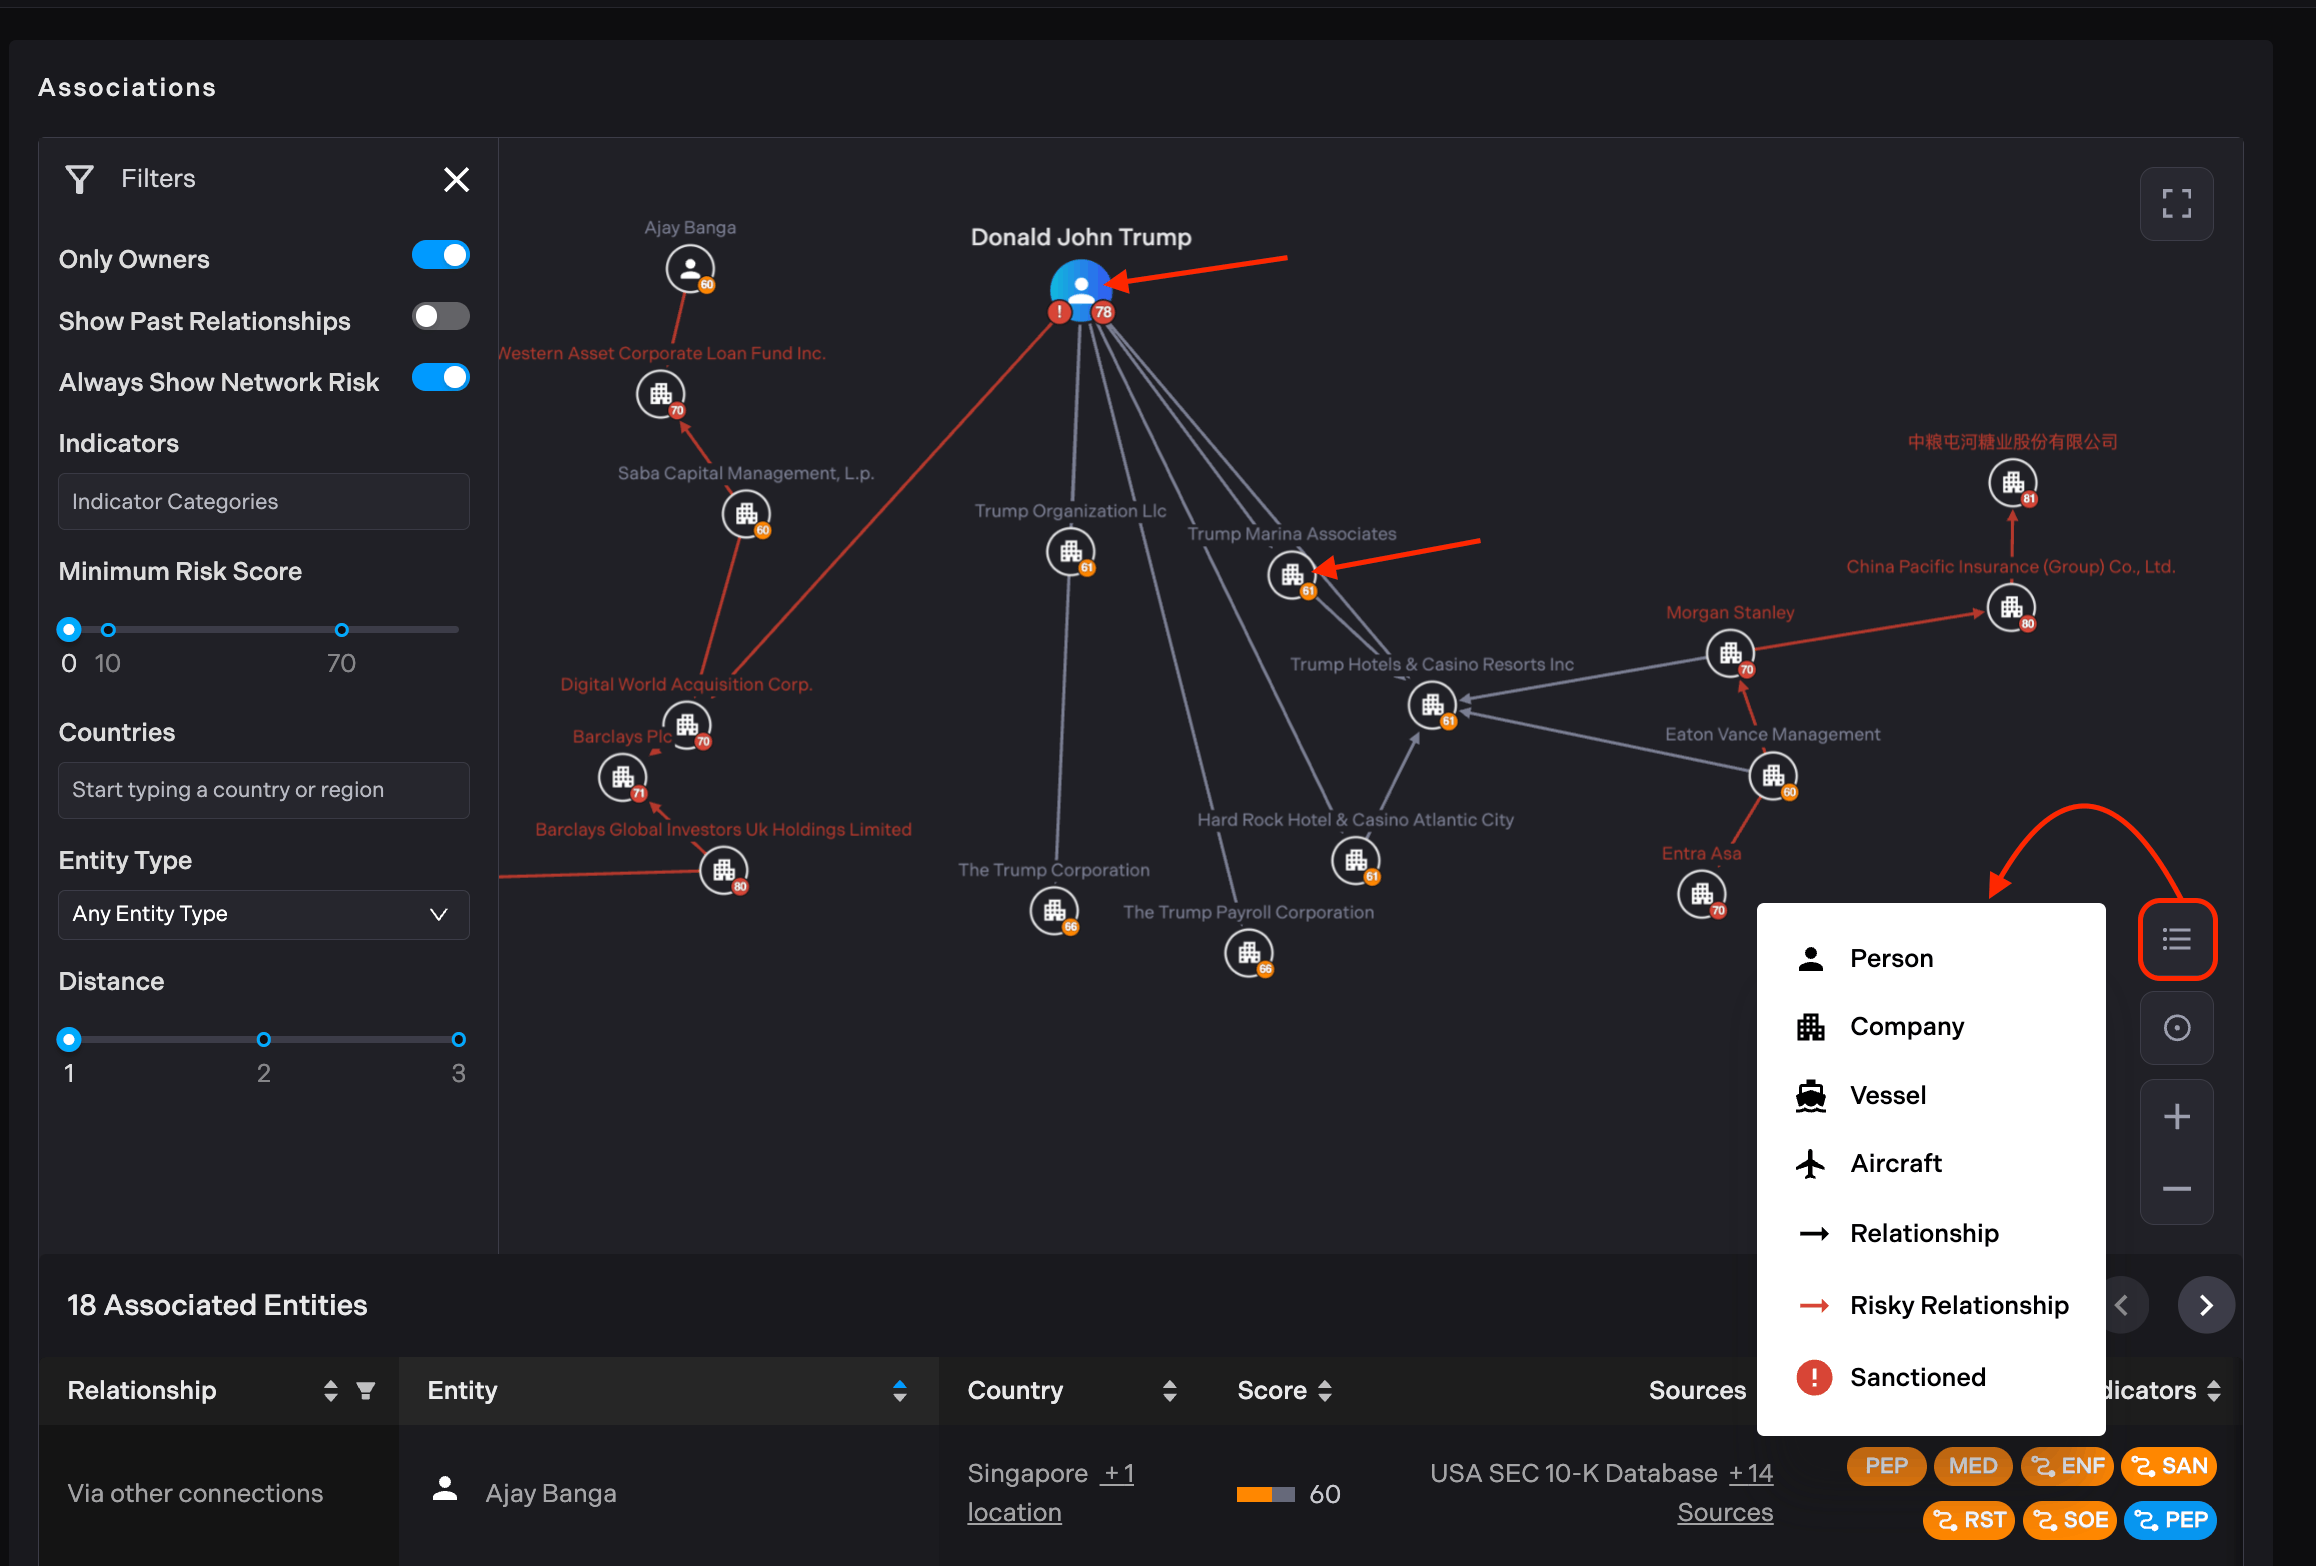
The icon in the center indicates the entity type. A building for companies. A person for people. A ship for vessels. A plane for aircraft.
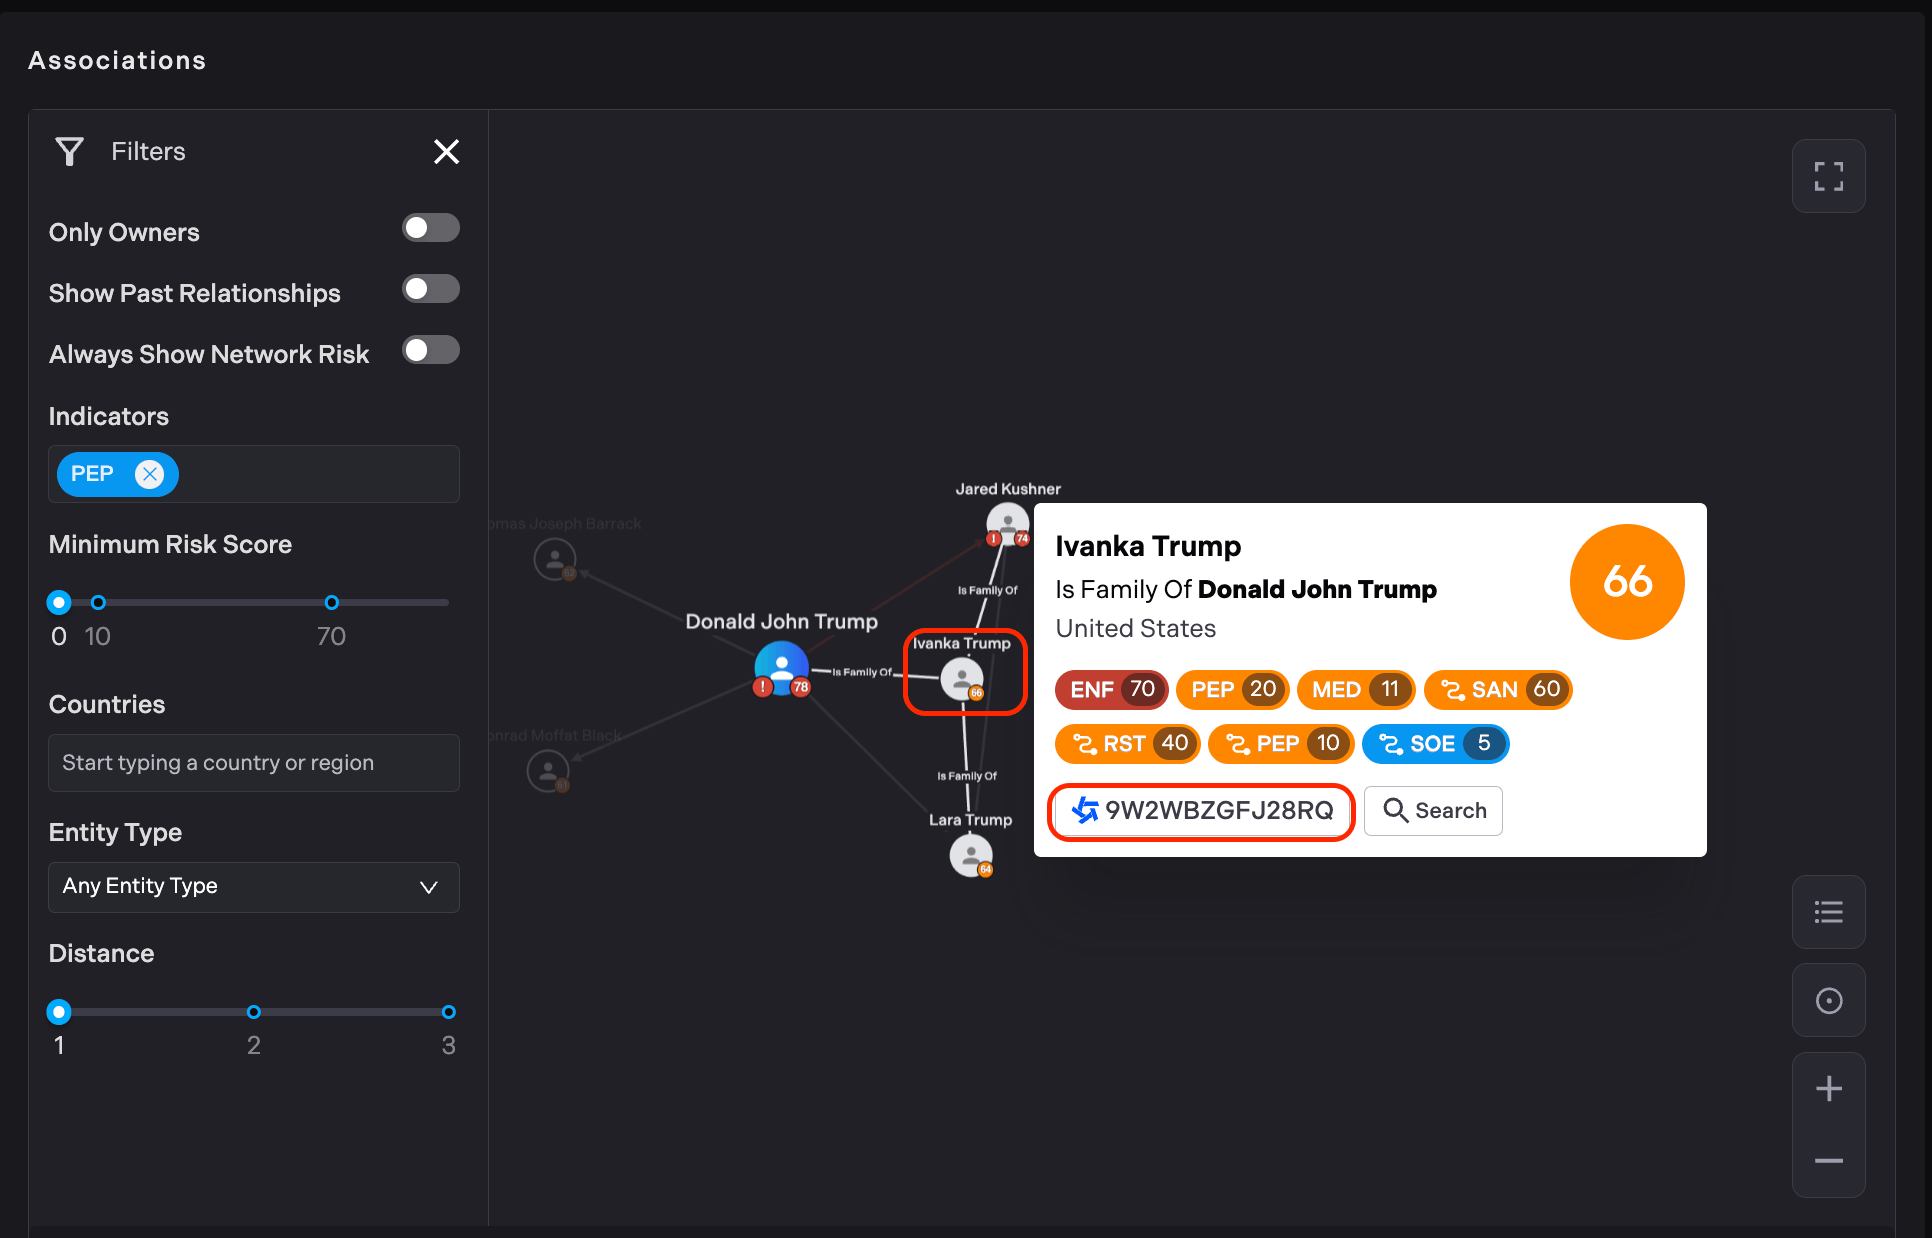
By clicking once on the entity node in the graph, users can view detailed information, including its score and the full set of risk indicators. All nodes in the graph represent Sigma IDs in the system.
Users can double-click on any node to expand it and view relationships as far as they wish. Expanded node will be indicated by a double outlined circle.
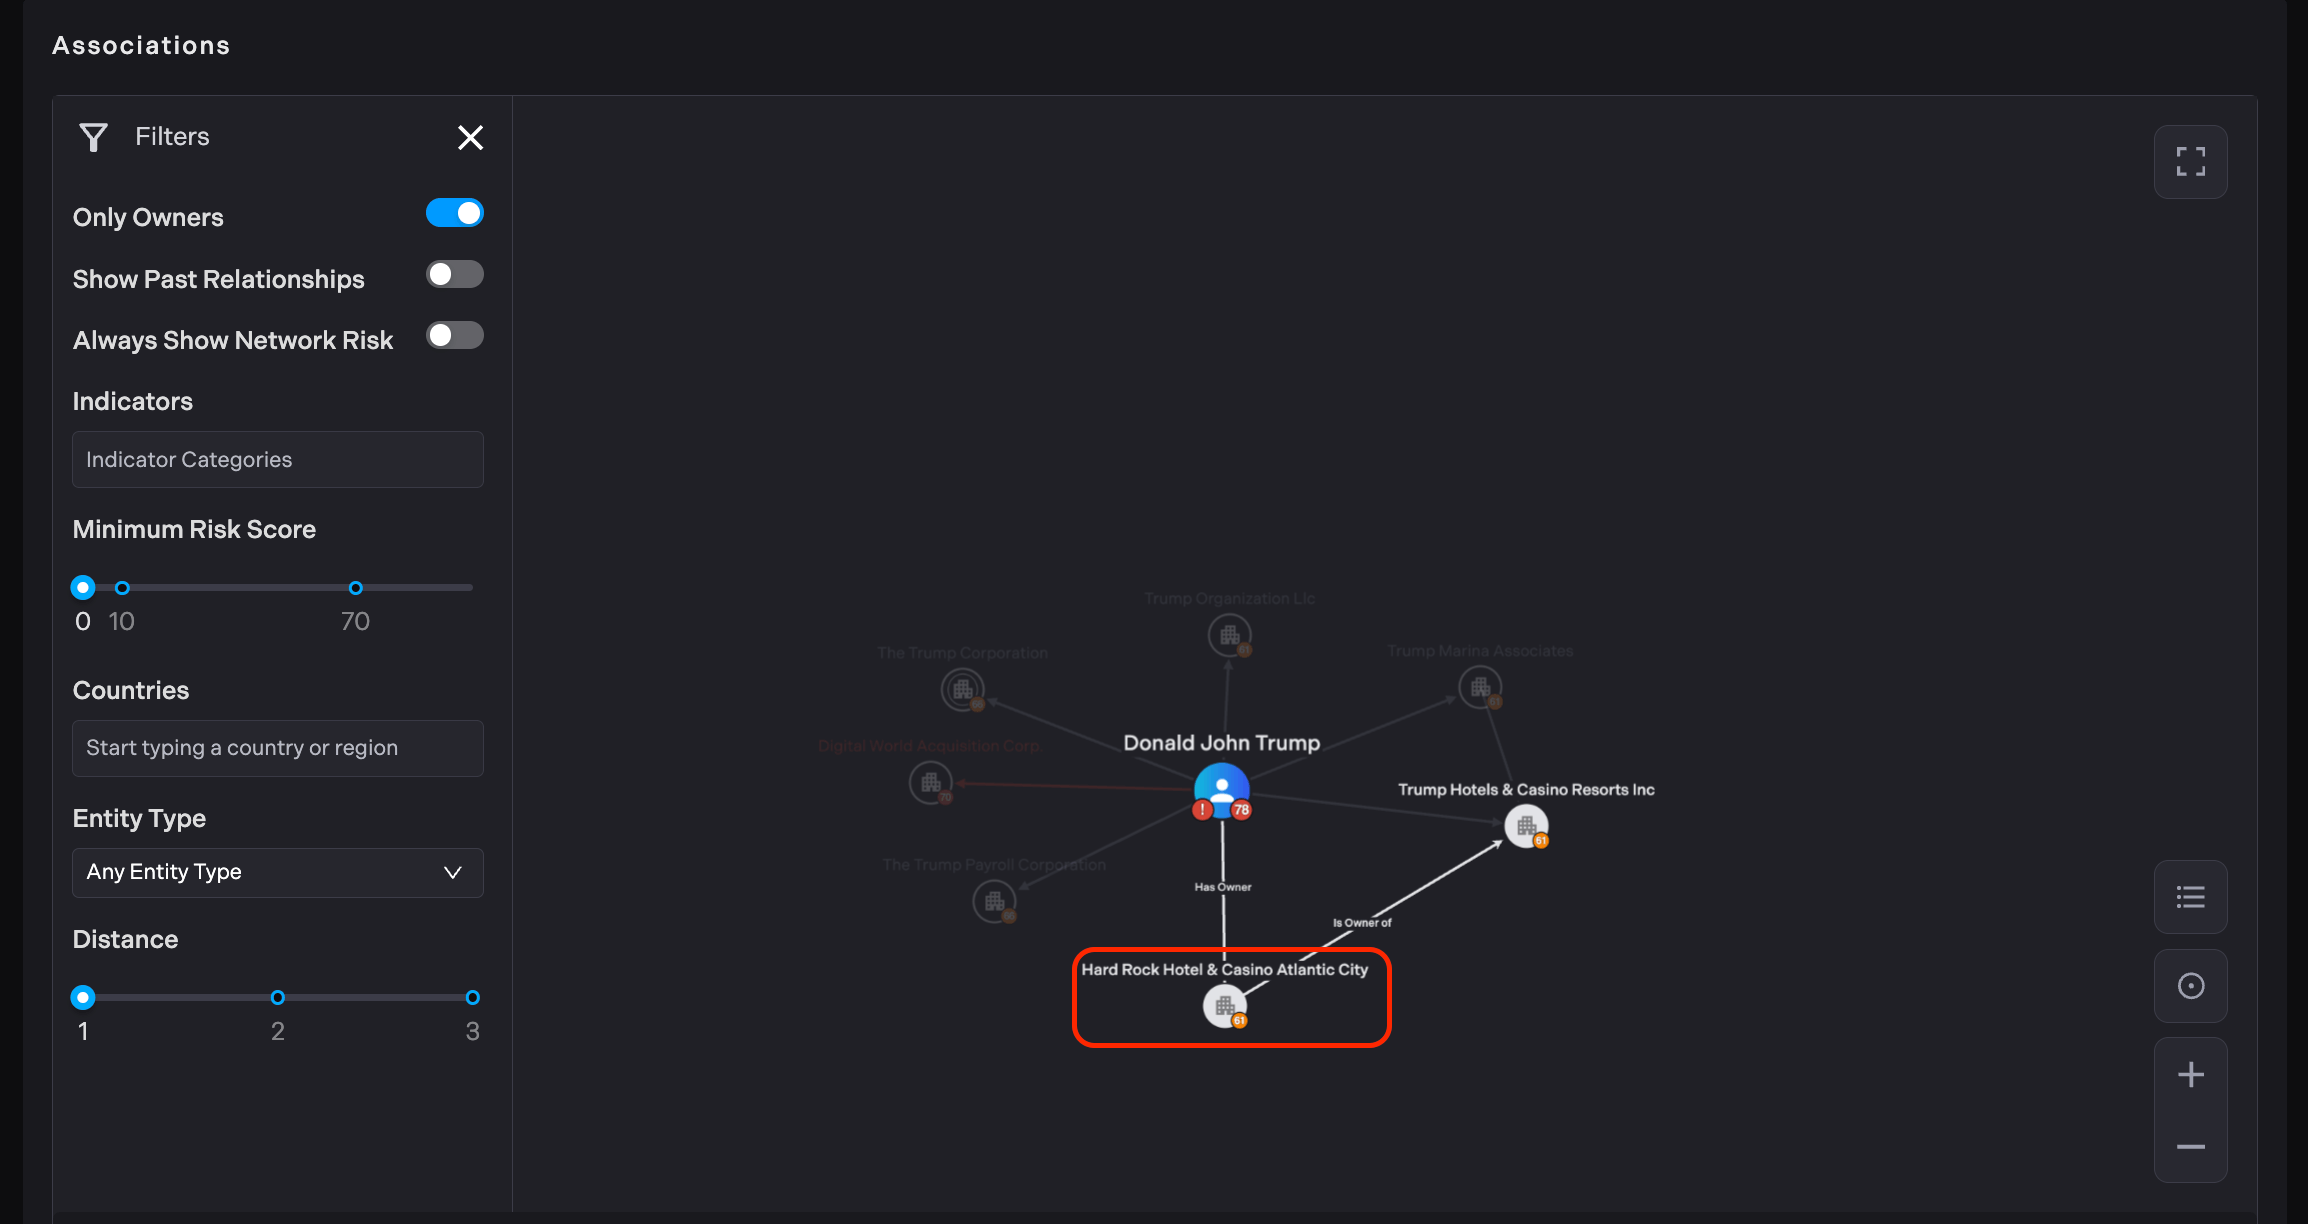
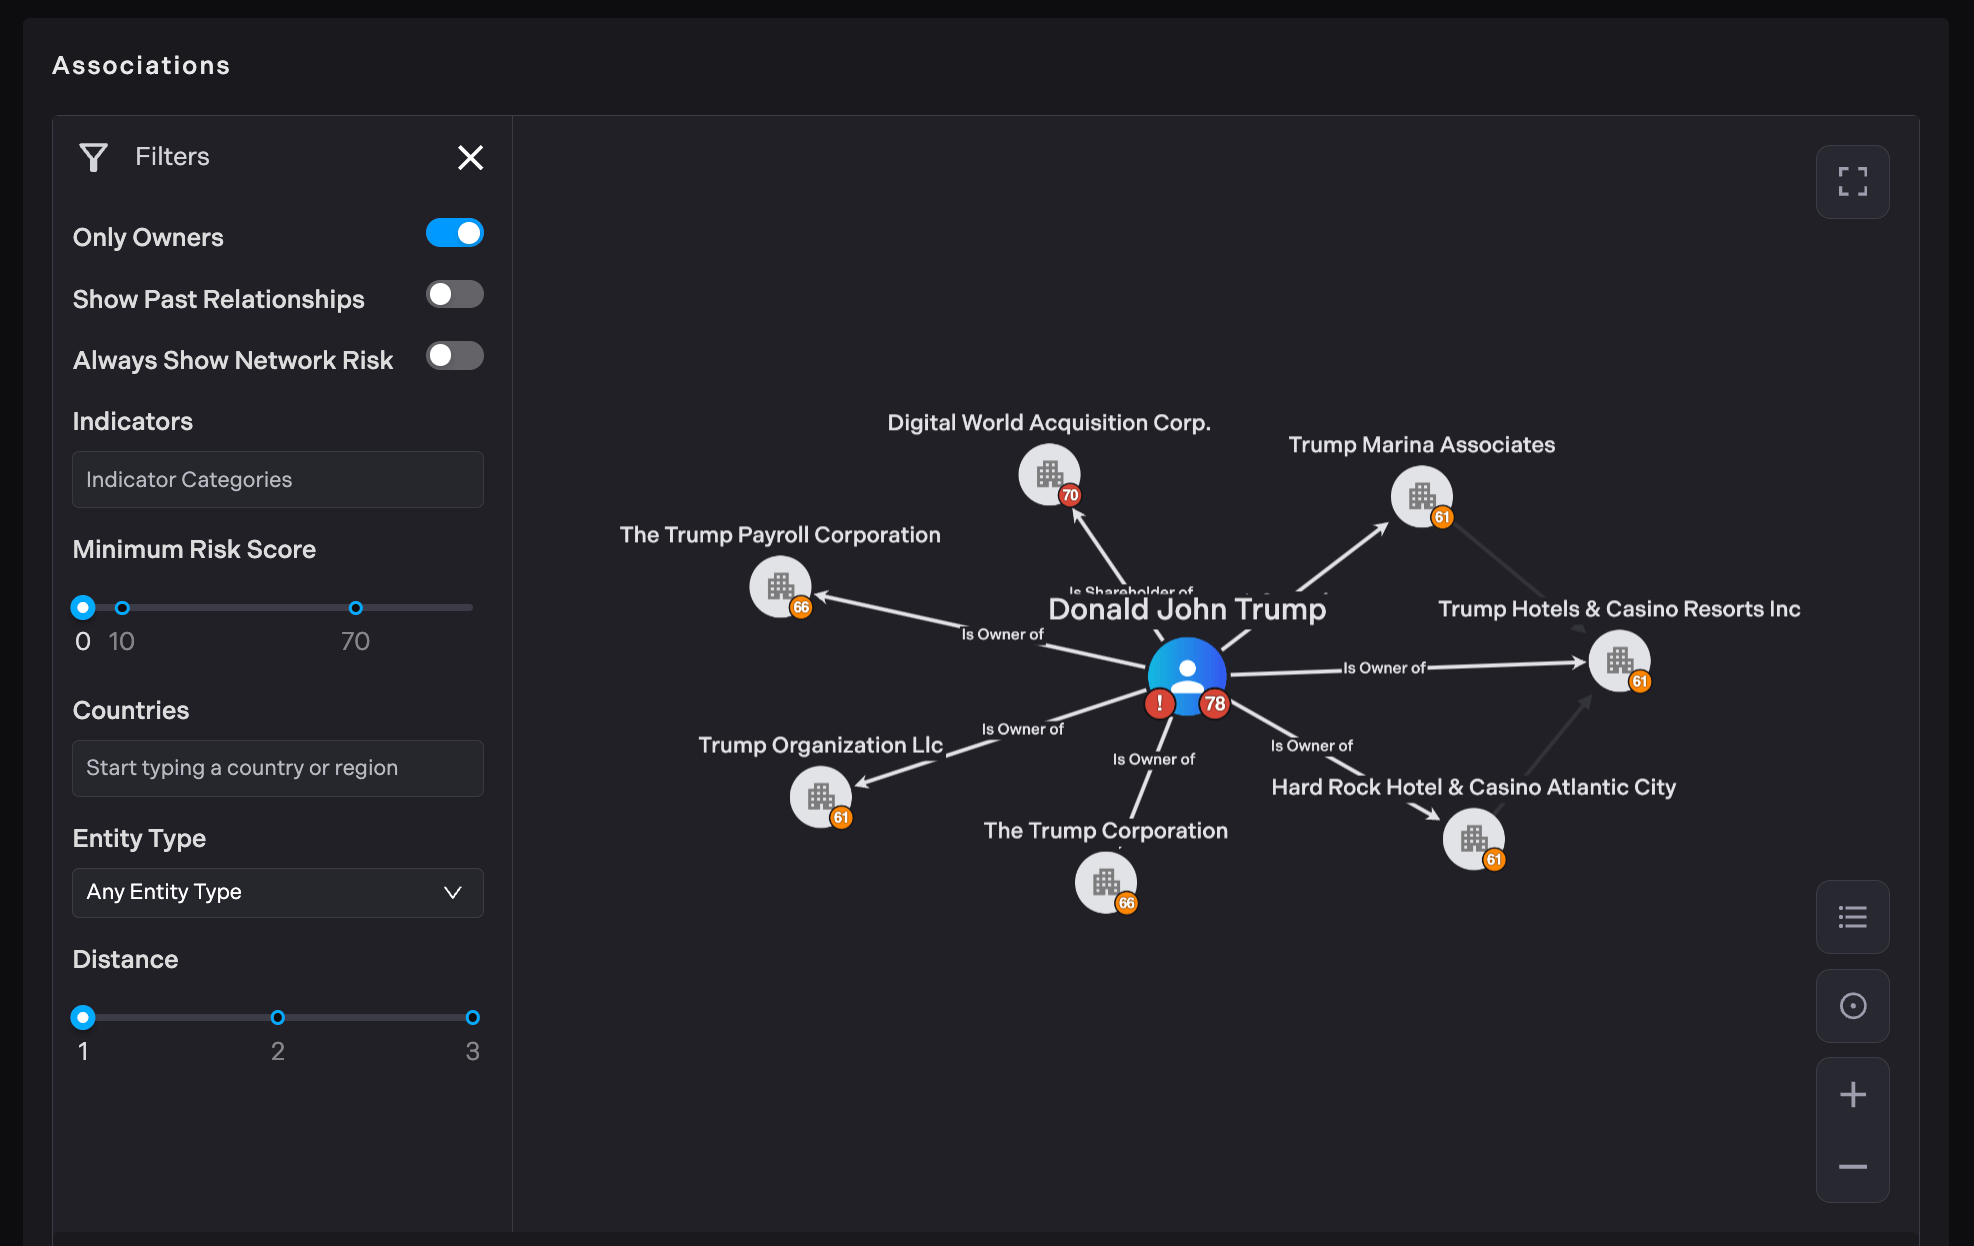
Users can filter entities by ownership, status of relationship, indicators, score, location and entity type. By toggling the "Only Owners" filter on, the graph will display only the ownership relationships and nodes directly related to those ownership connections. All other nodes and relationships not representing direct ownership will be removed from the graph, allowing users to focus specifically on understanding the ownership structures and hierarchies present within the network data.
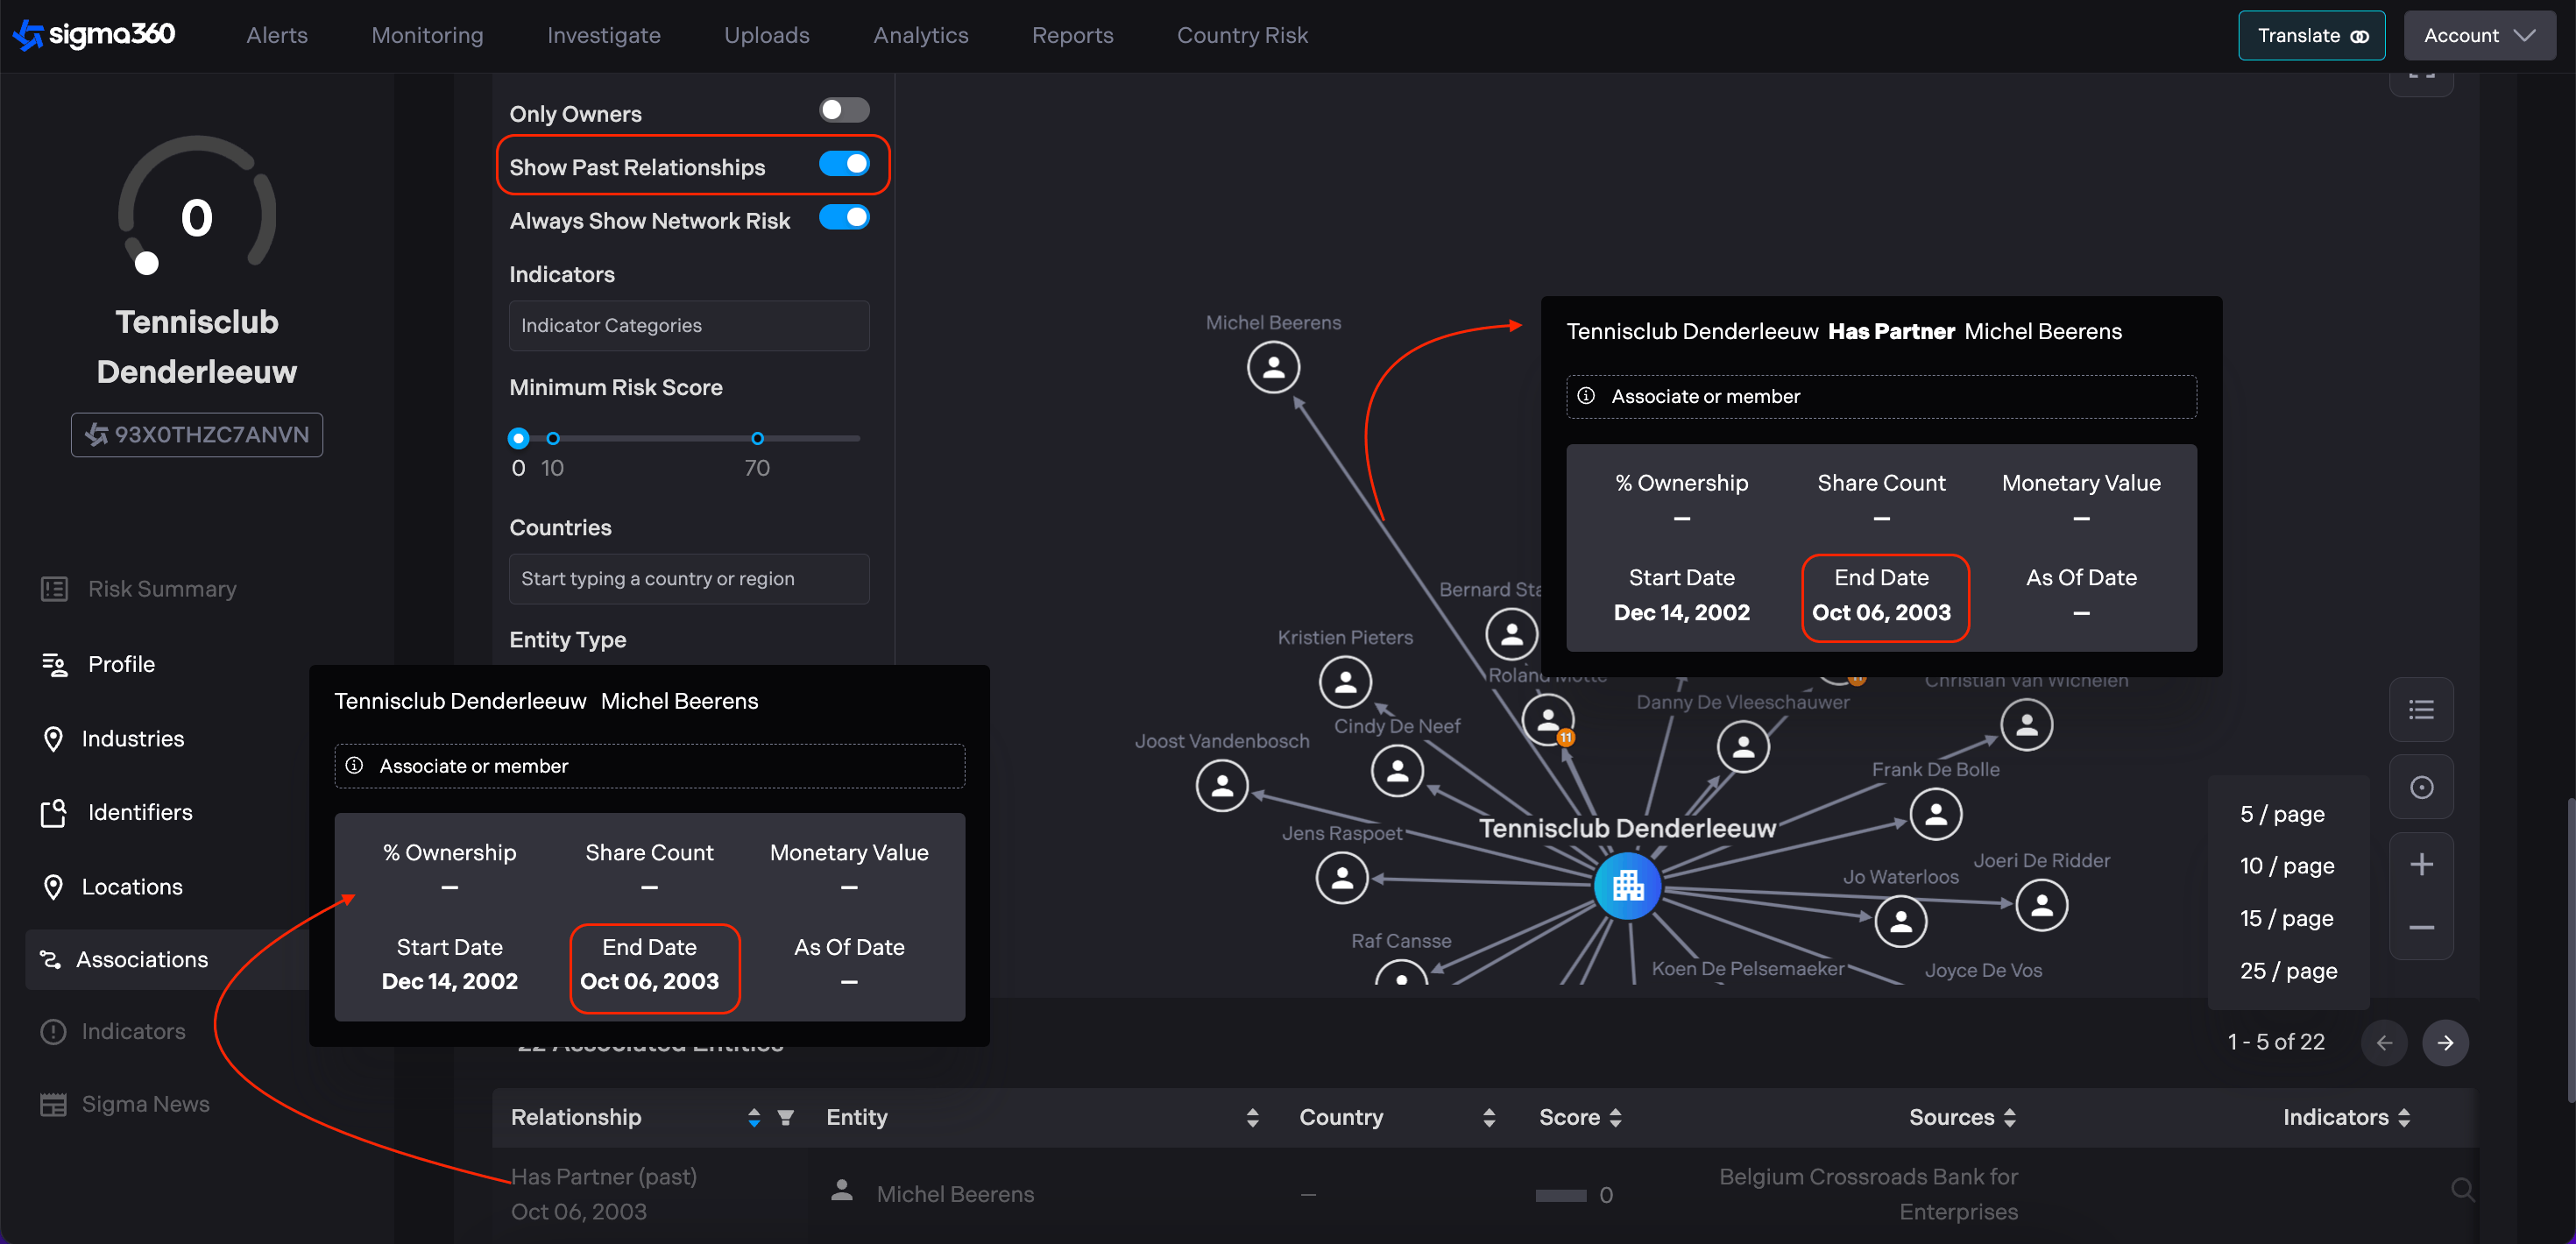
By default, the graph filters out past or expired relationships, helping reduce noise in the network view. Users have the ability to toggle ON the "Show Past Relationships" option to view expired relationships as well. Expired relationships are visually distinguished by being grayed out in color and displaying an End Date. Clicking once on the relationships' connections in the graph or in the associations table, users can view detailed information such as % Ownership, Share Counts as well as Start and End Date when available.
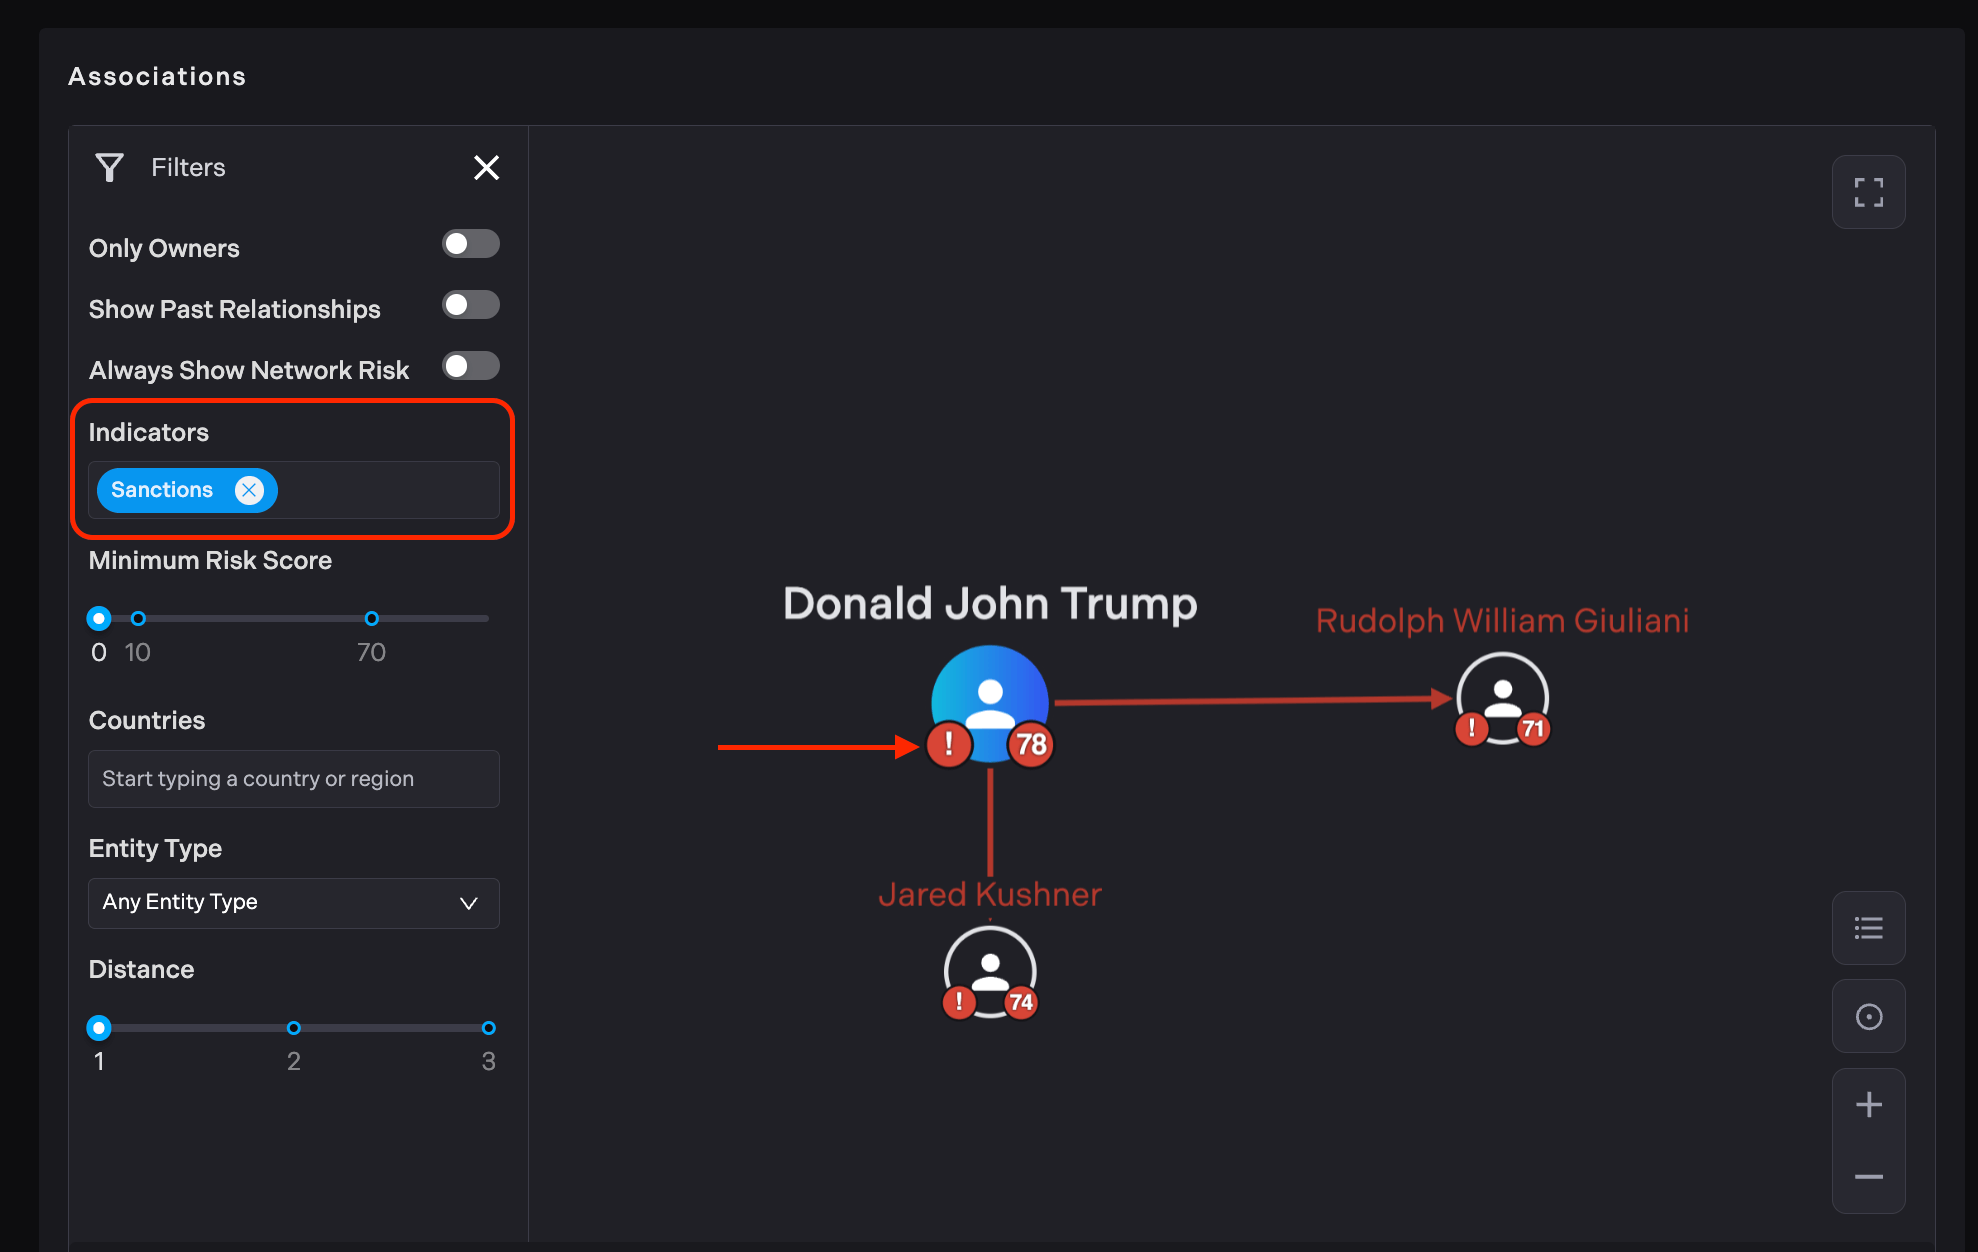
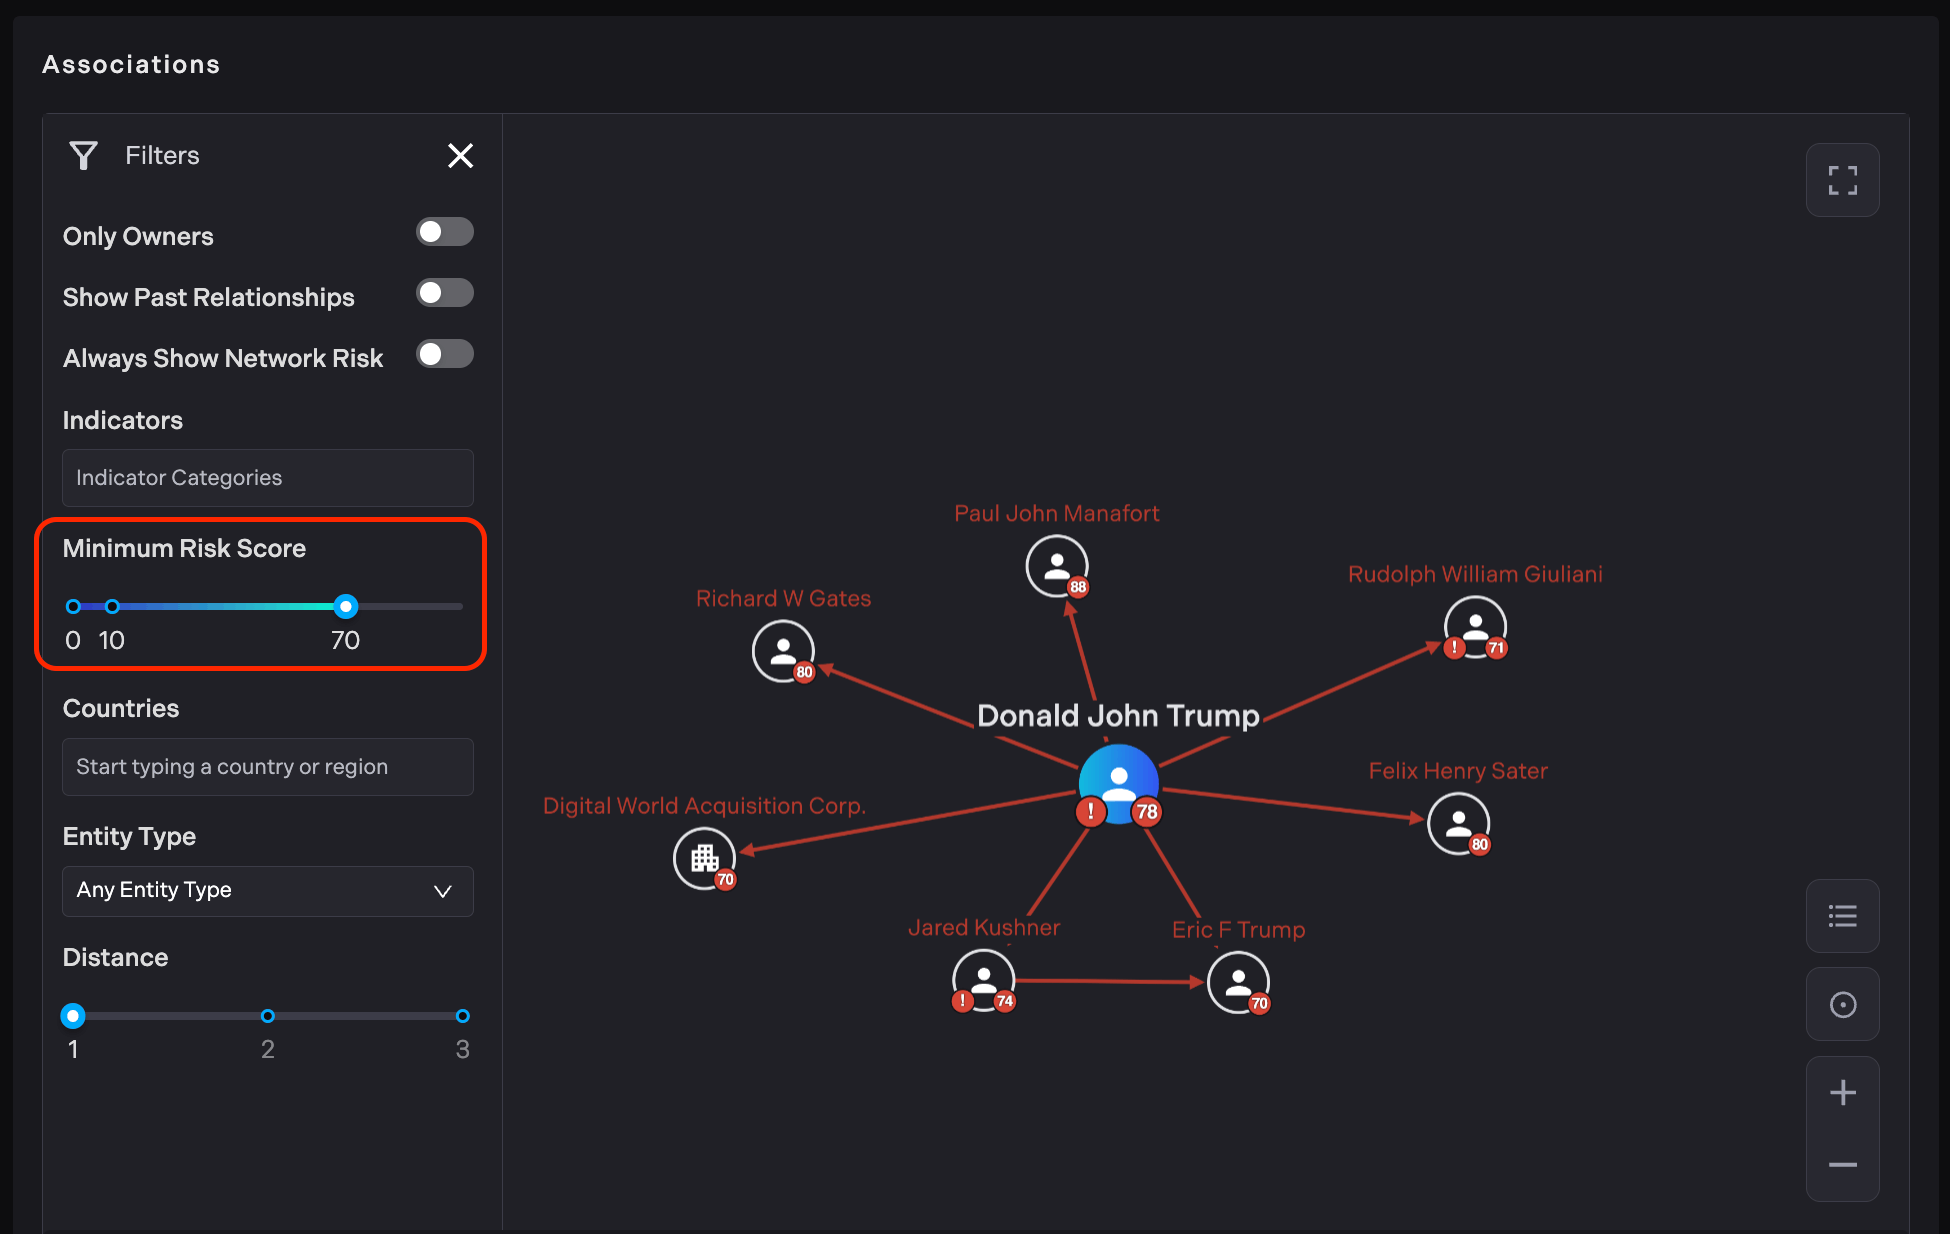
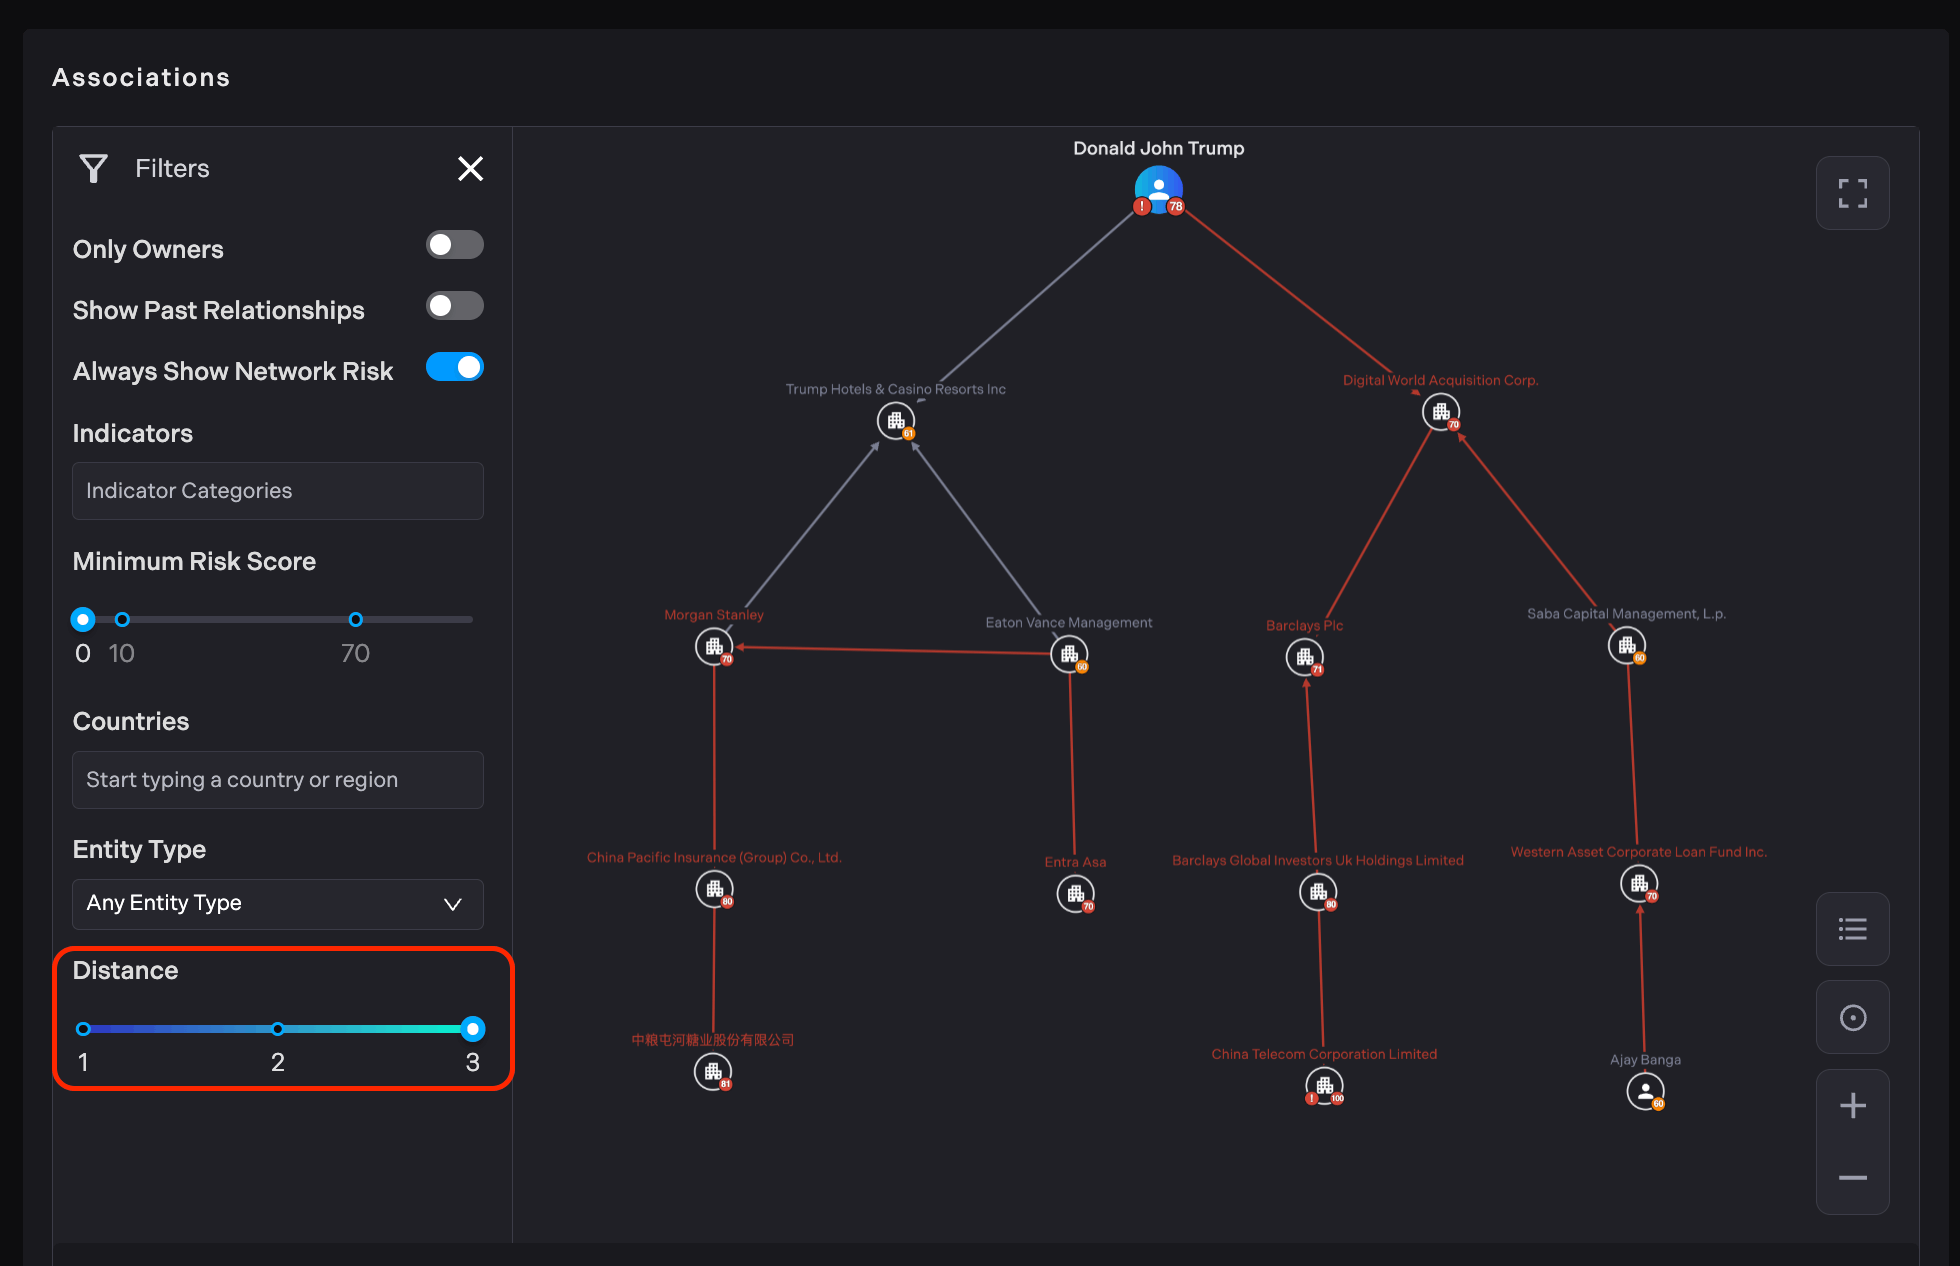
Left side panel includes an "Indicators" section where users can select specific indicator categories to filter the entities displayed in the network graph. The red exclamation point icon next to the nodes represents those specific entities that have active sanctions associated with them. The red colored connections indicate high-risk relationships with risk scores ranging from 70 to 100.
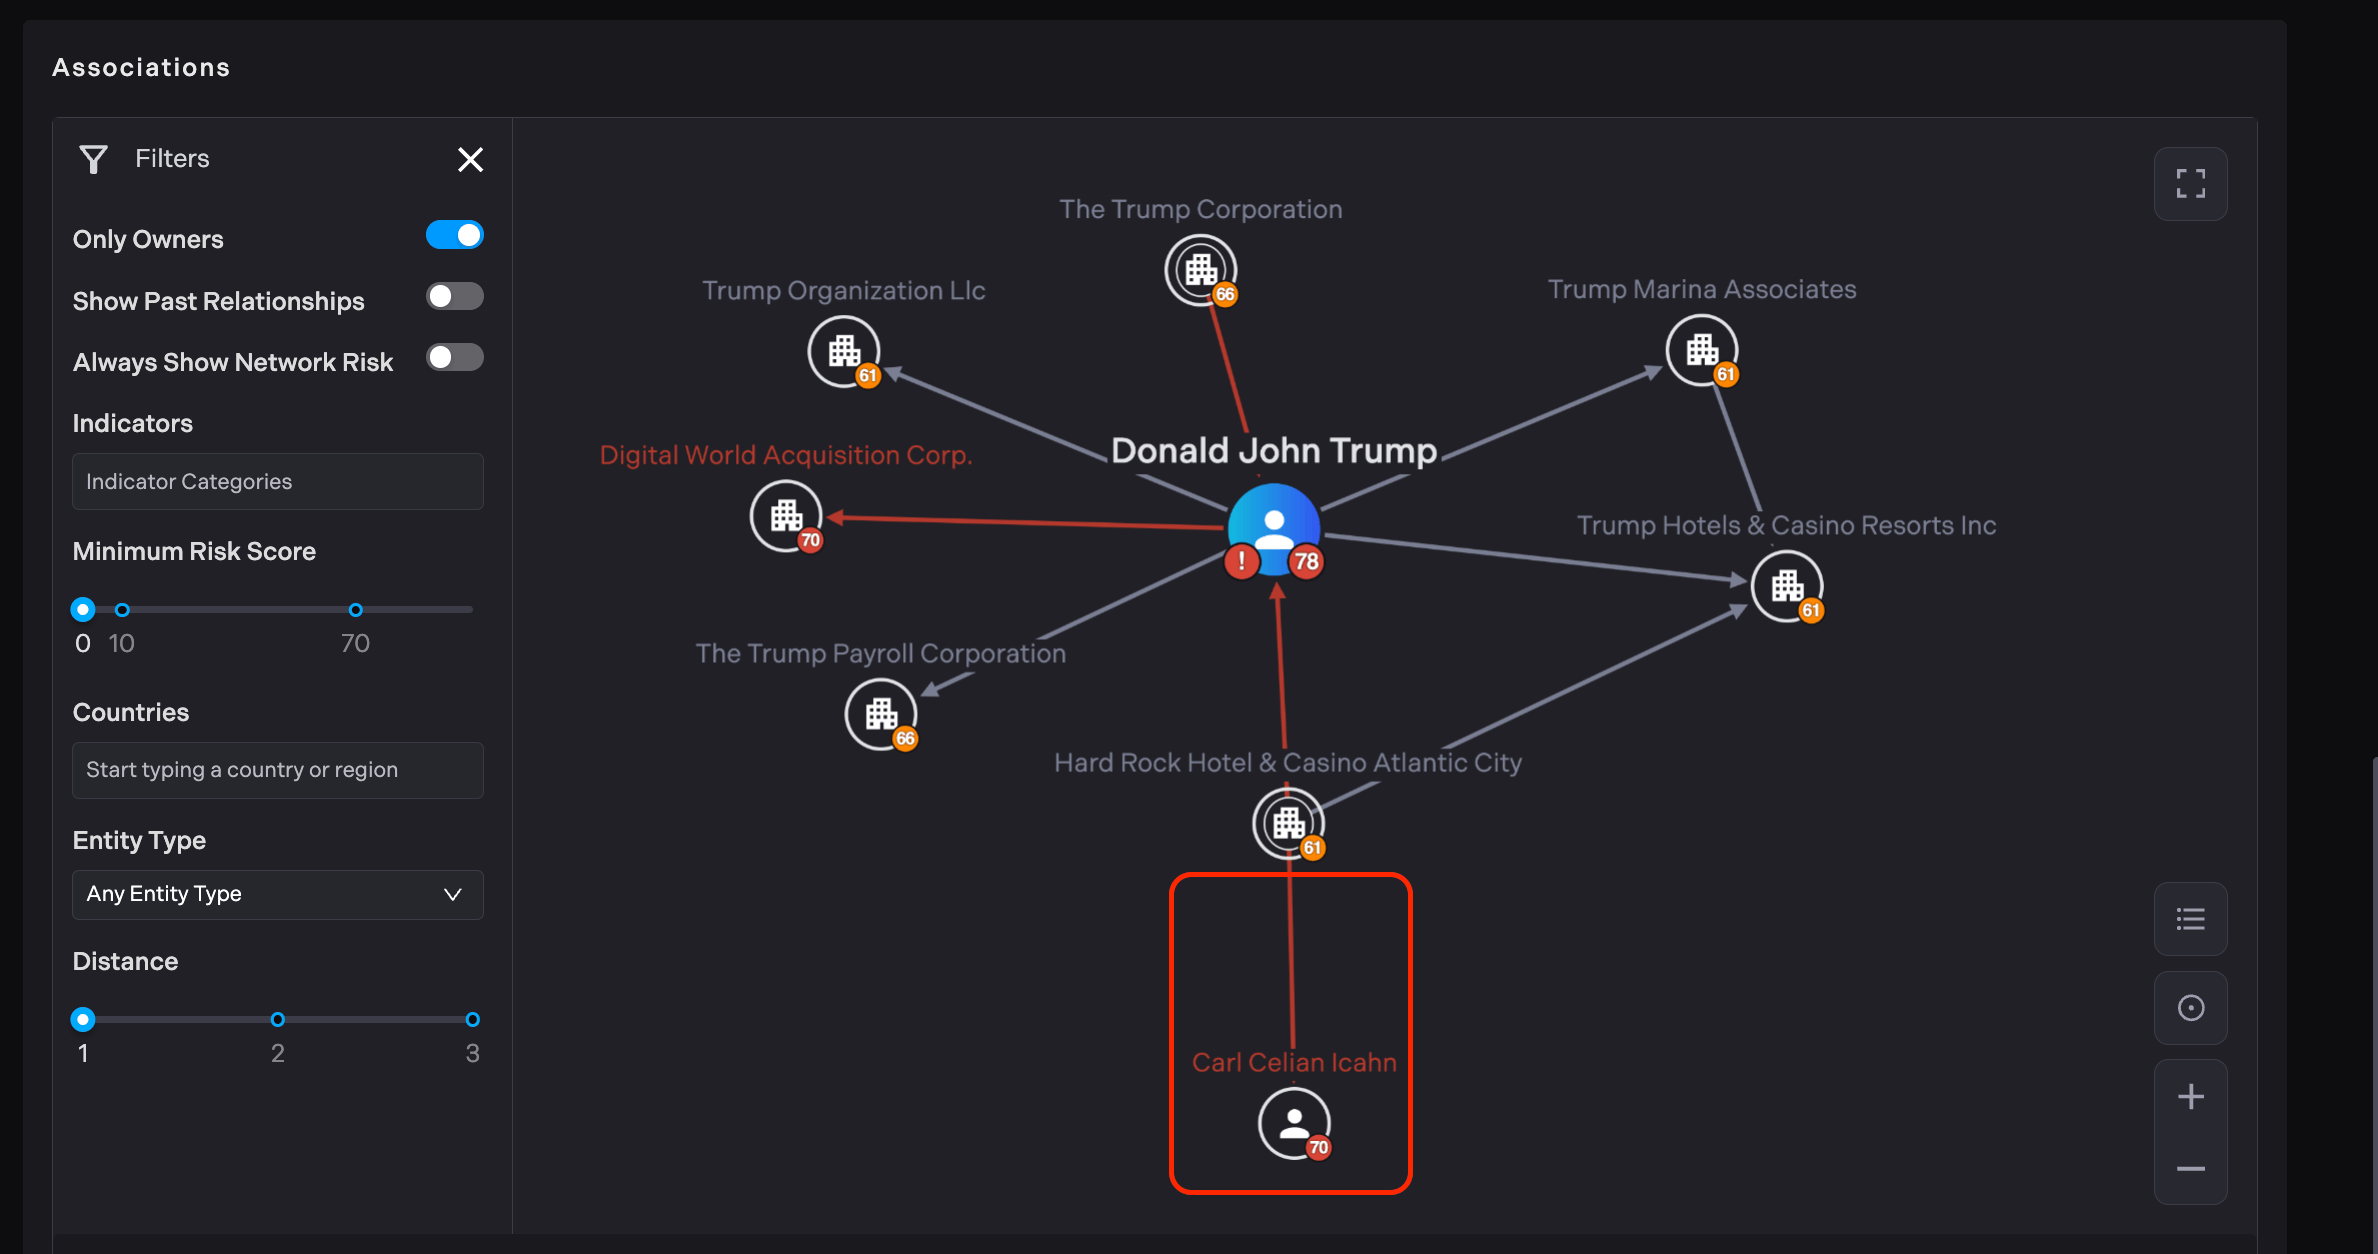
This Risk Score threshold enables users to quickly identify the most potentially problematic or high-risk associations in the network. In this example the "Minimum Risk Score" slider is set to 70, meaning only nodes with a risk score of 70 or higher will be displayed.
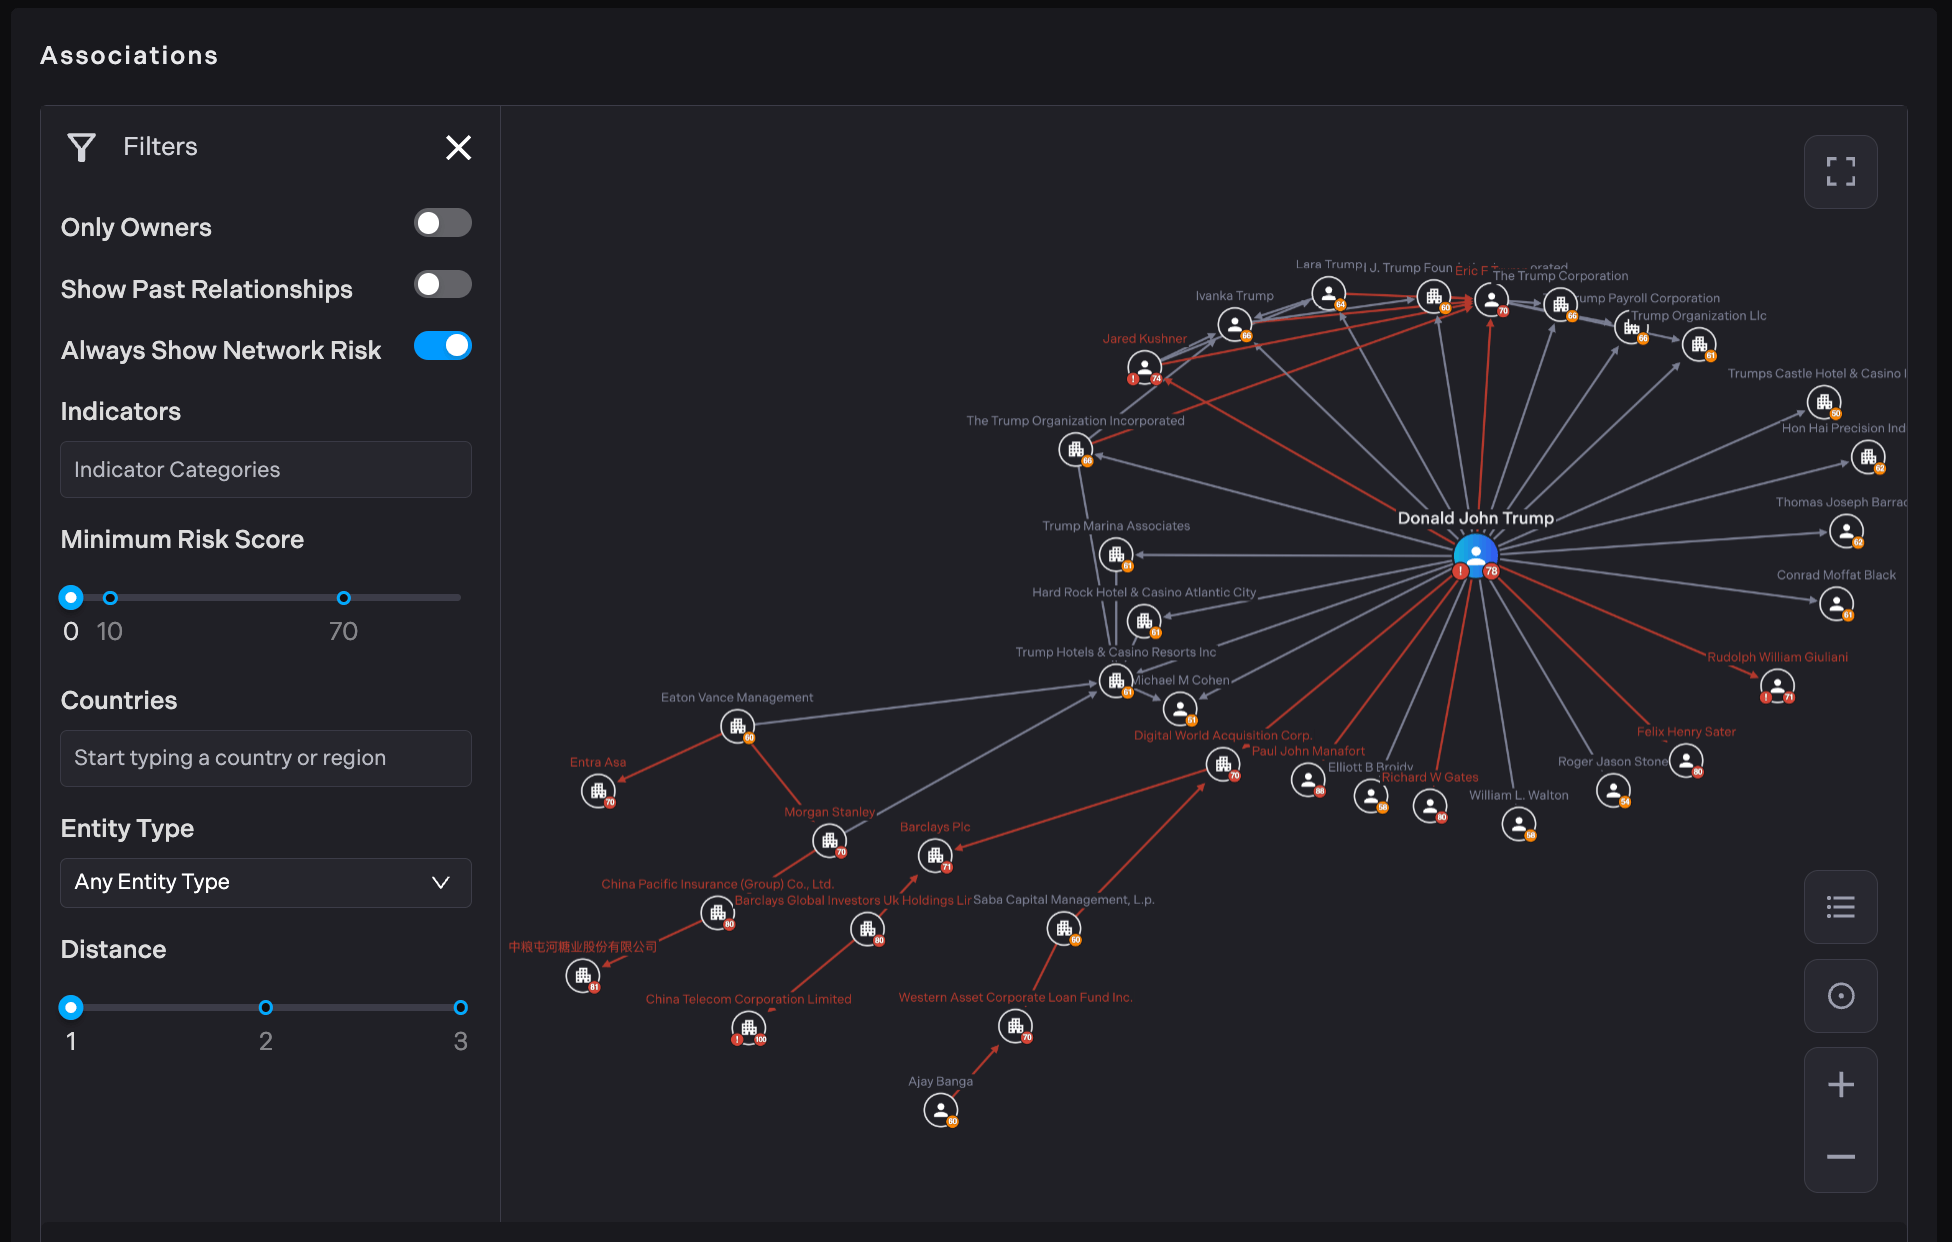
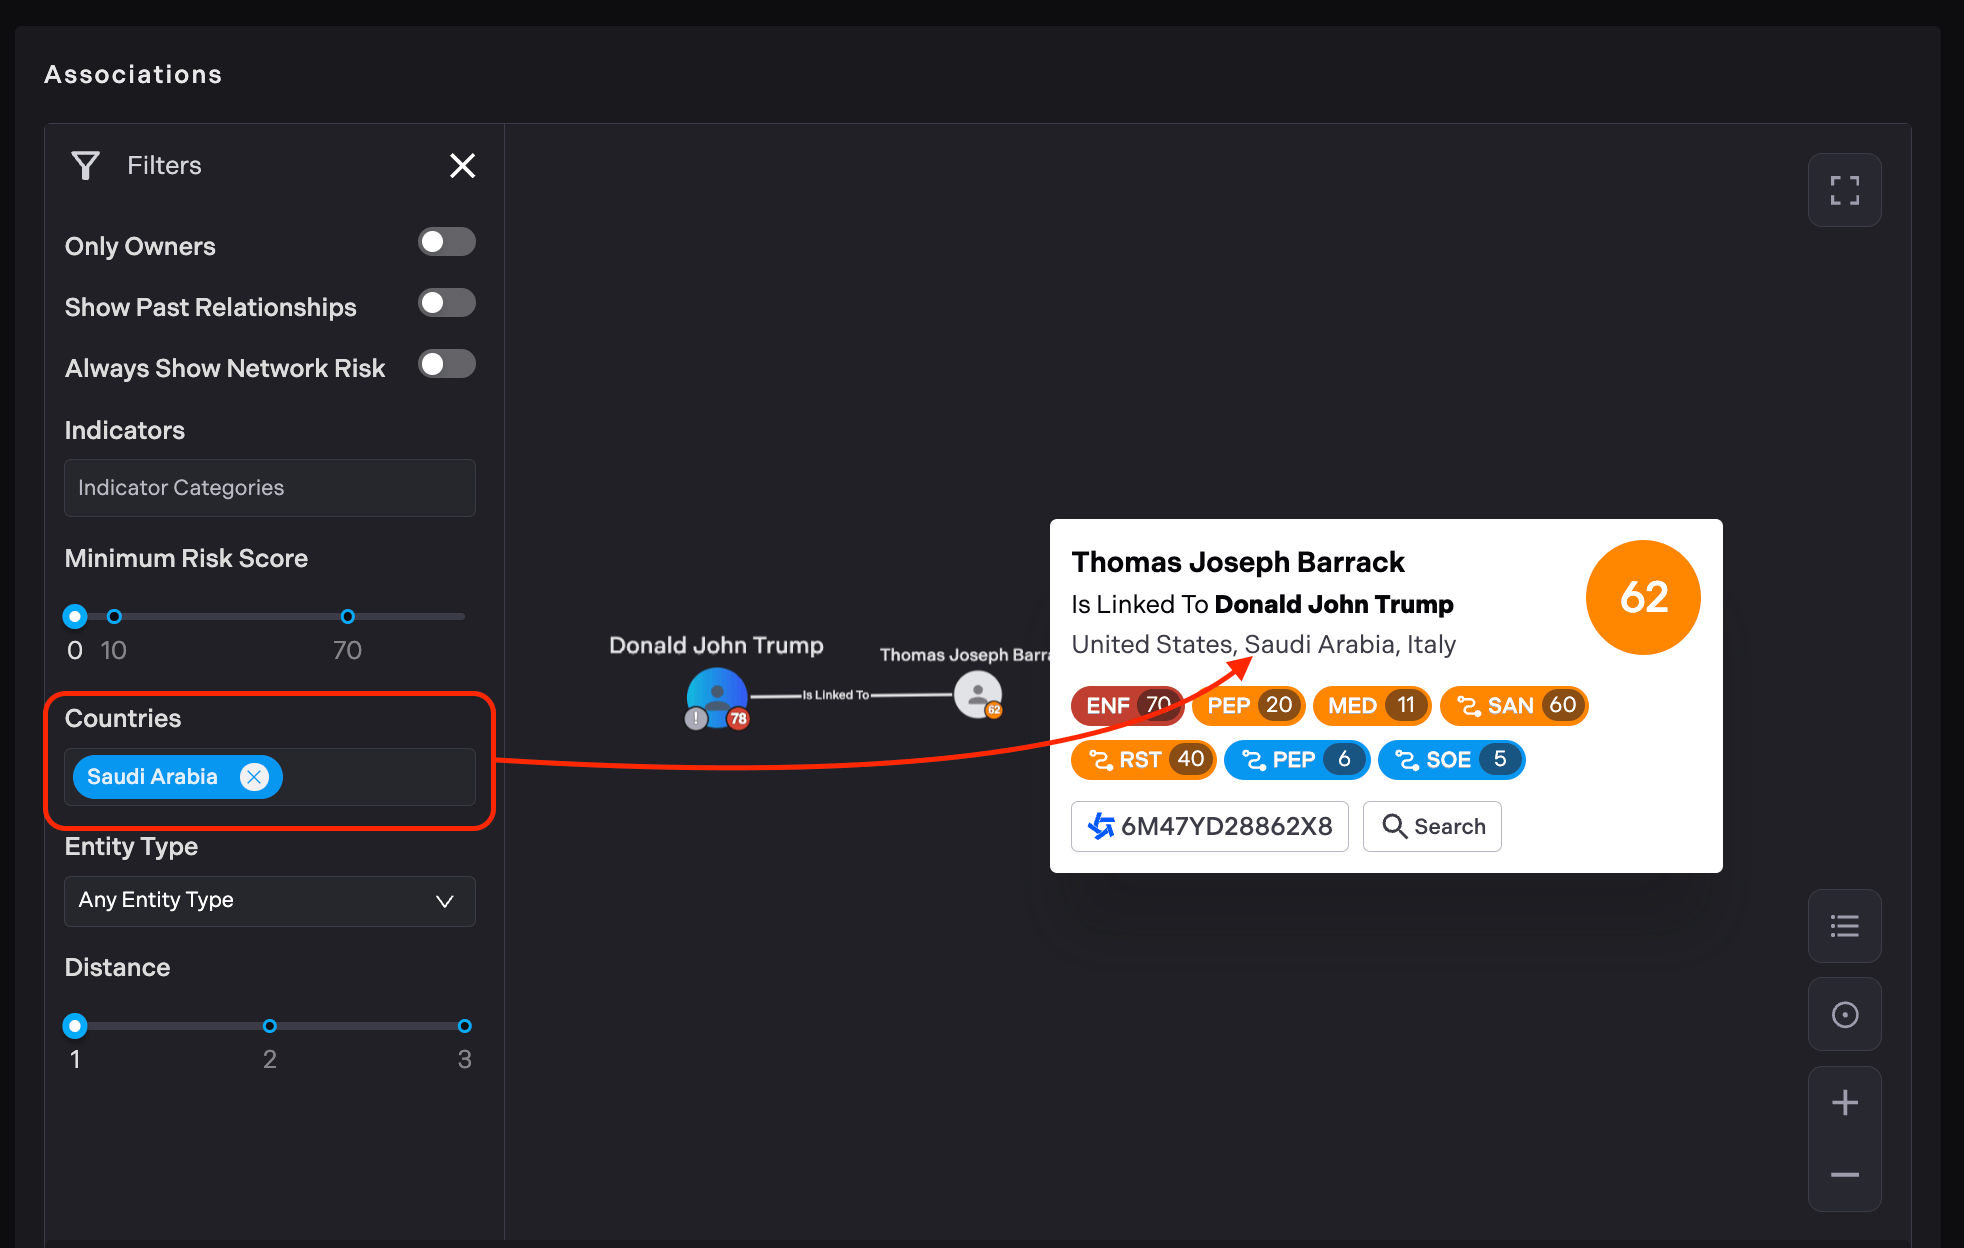
The "Countries" filter in the left panel allows users to select specific countries to filter the network graph. When a country filter is applied, the graph will only display nodes (entities) that are associated with the selected country or countries. This filtering capability allows users to focus on entities from specific geographic areas of interest, which can be particularly useful for region-specific analysis or compliance checks.
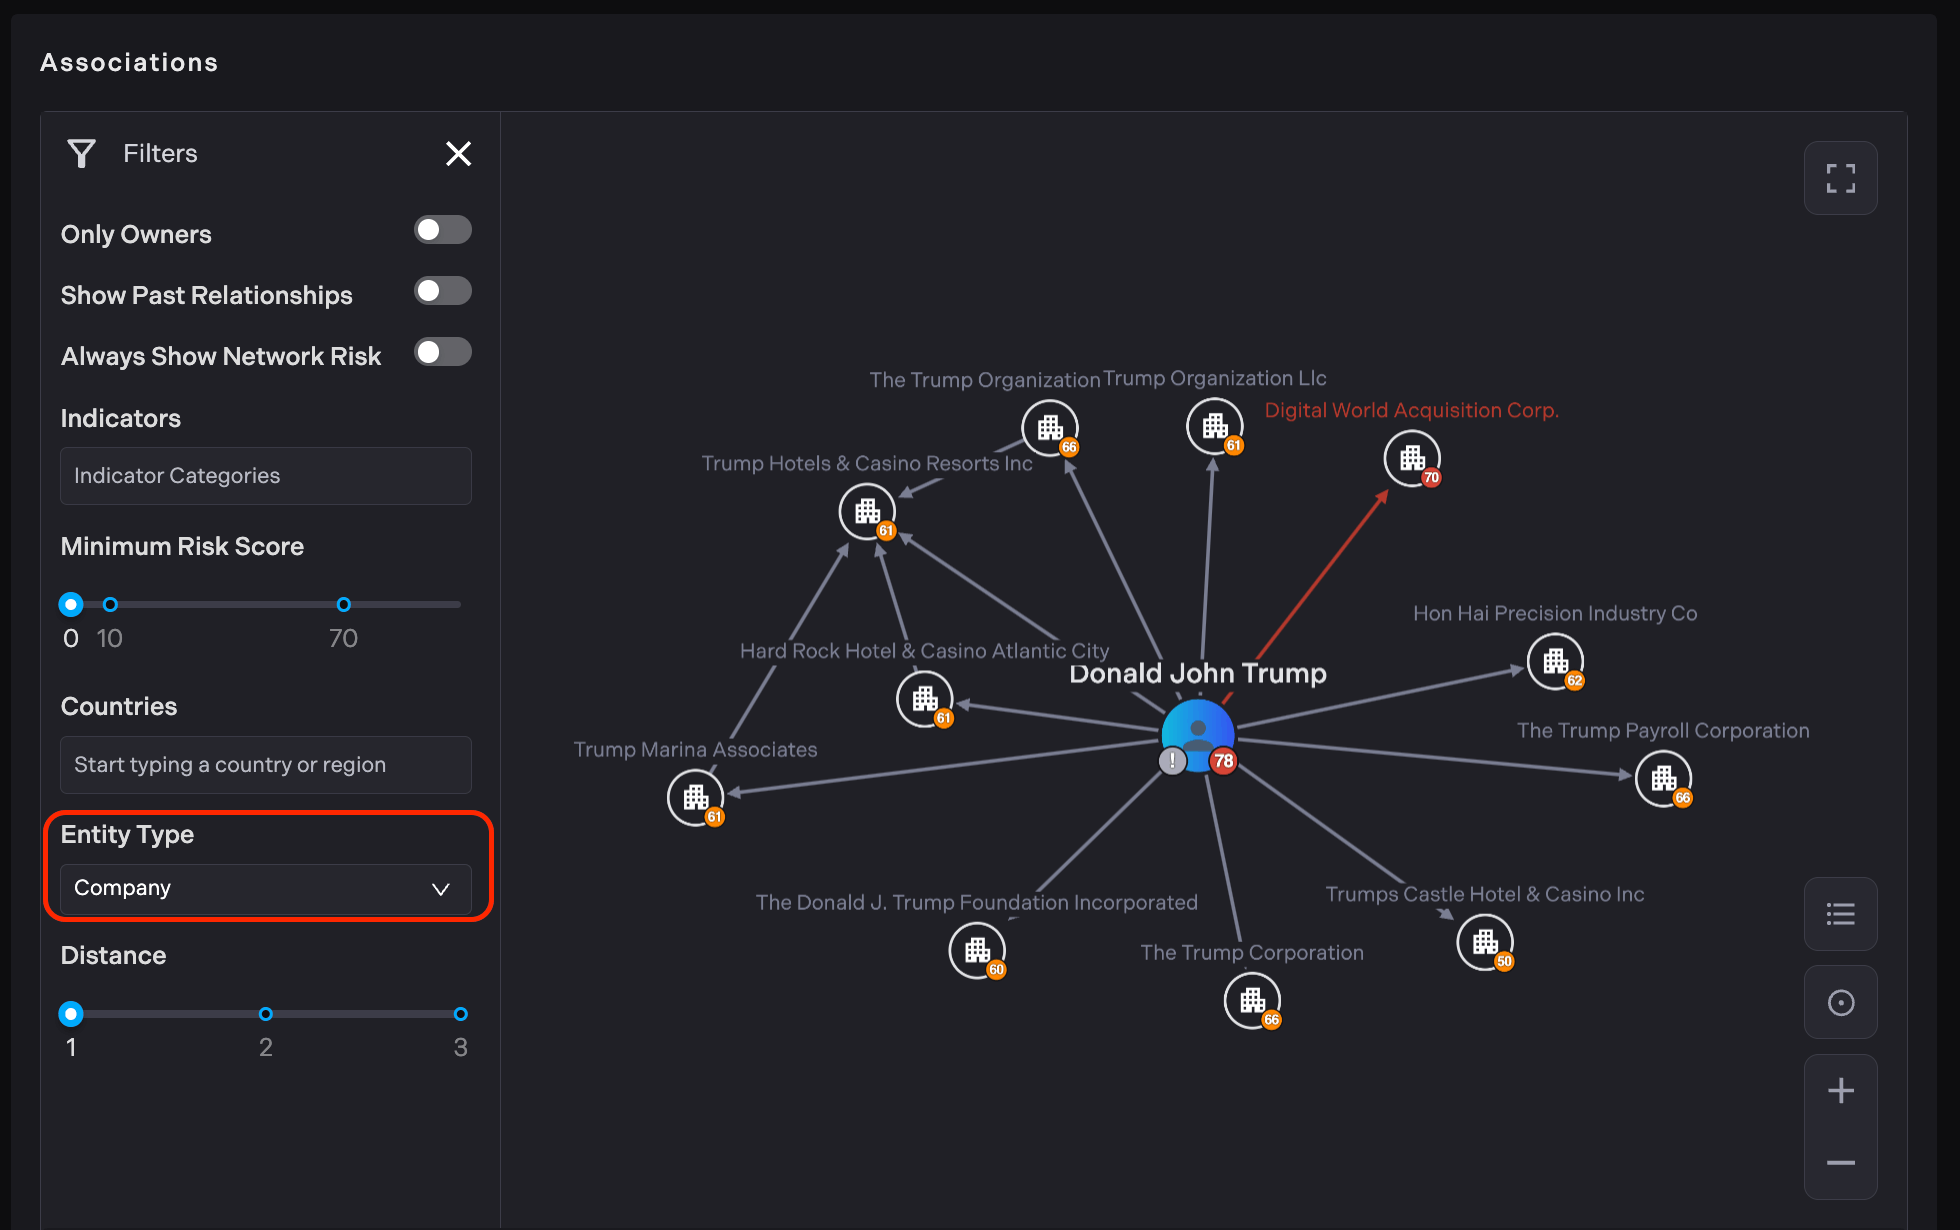
Users can filter nodes by their type using the "Entity Type" dropdown in the filter panel. In the current example, the graph has been filtered to show only company-type entities, which allows users to focus specifically on Trump's corporate connections, excluding other types of entities like individuals, vessels, or aircraft that might be present in the full network.
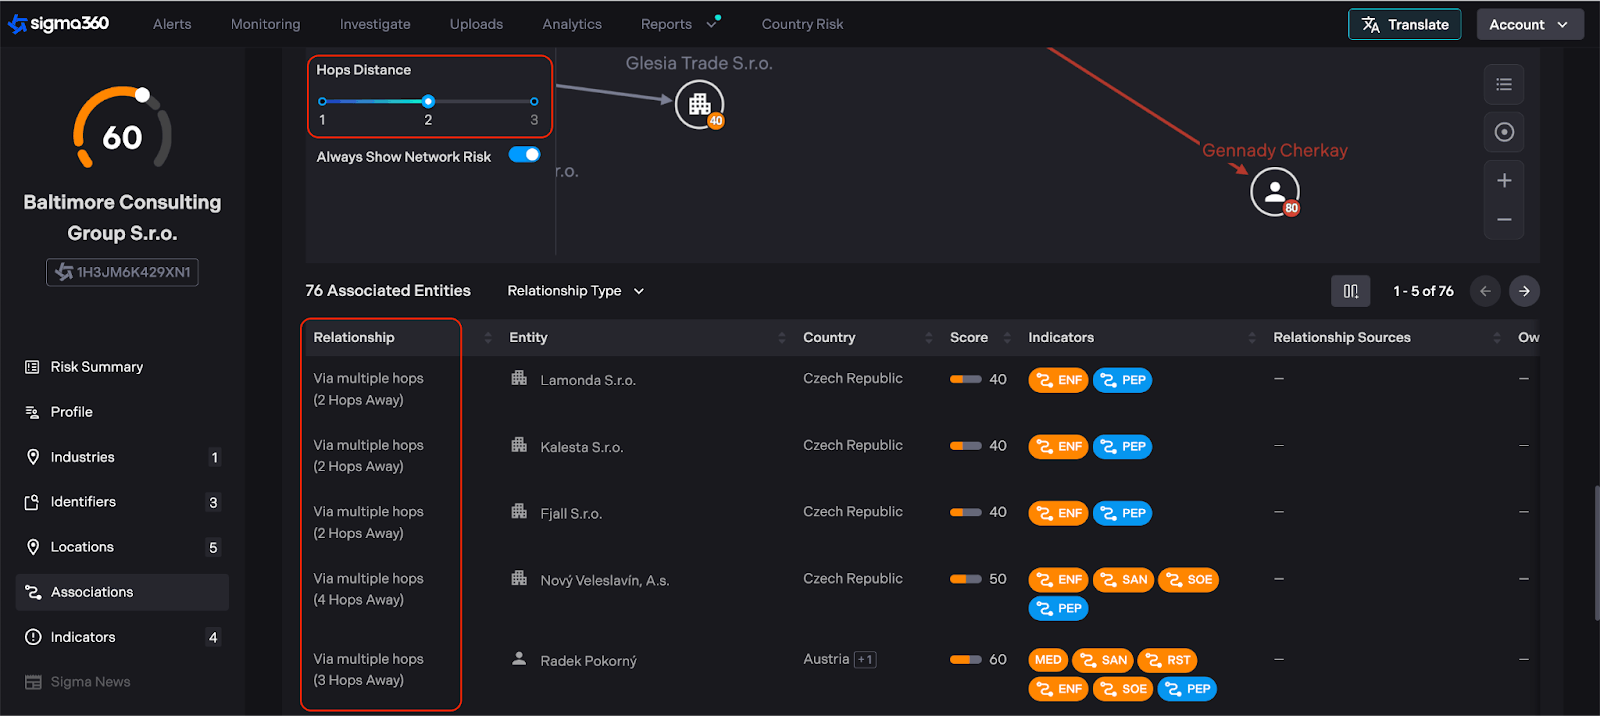
Users can automatically expand the size of the viewable network out to two and three degrees of distance.
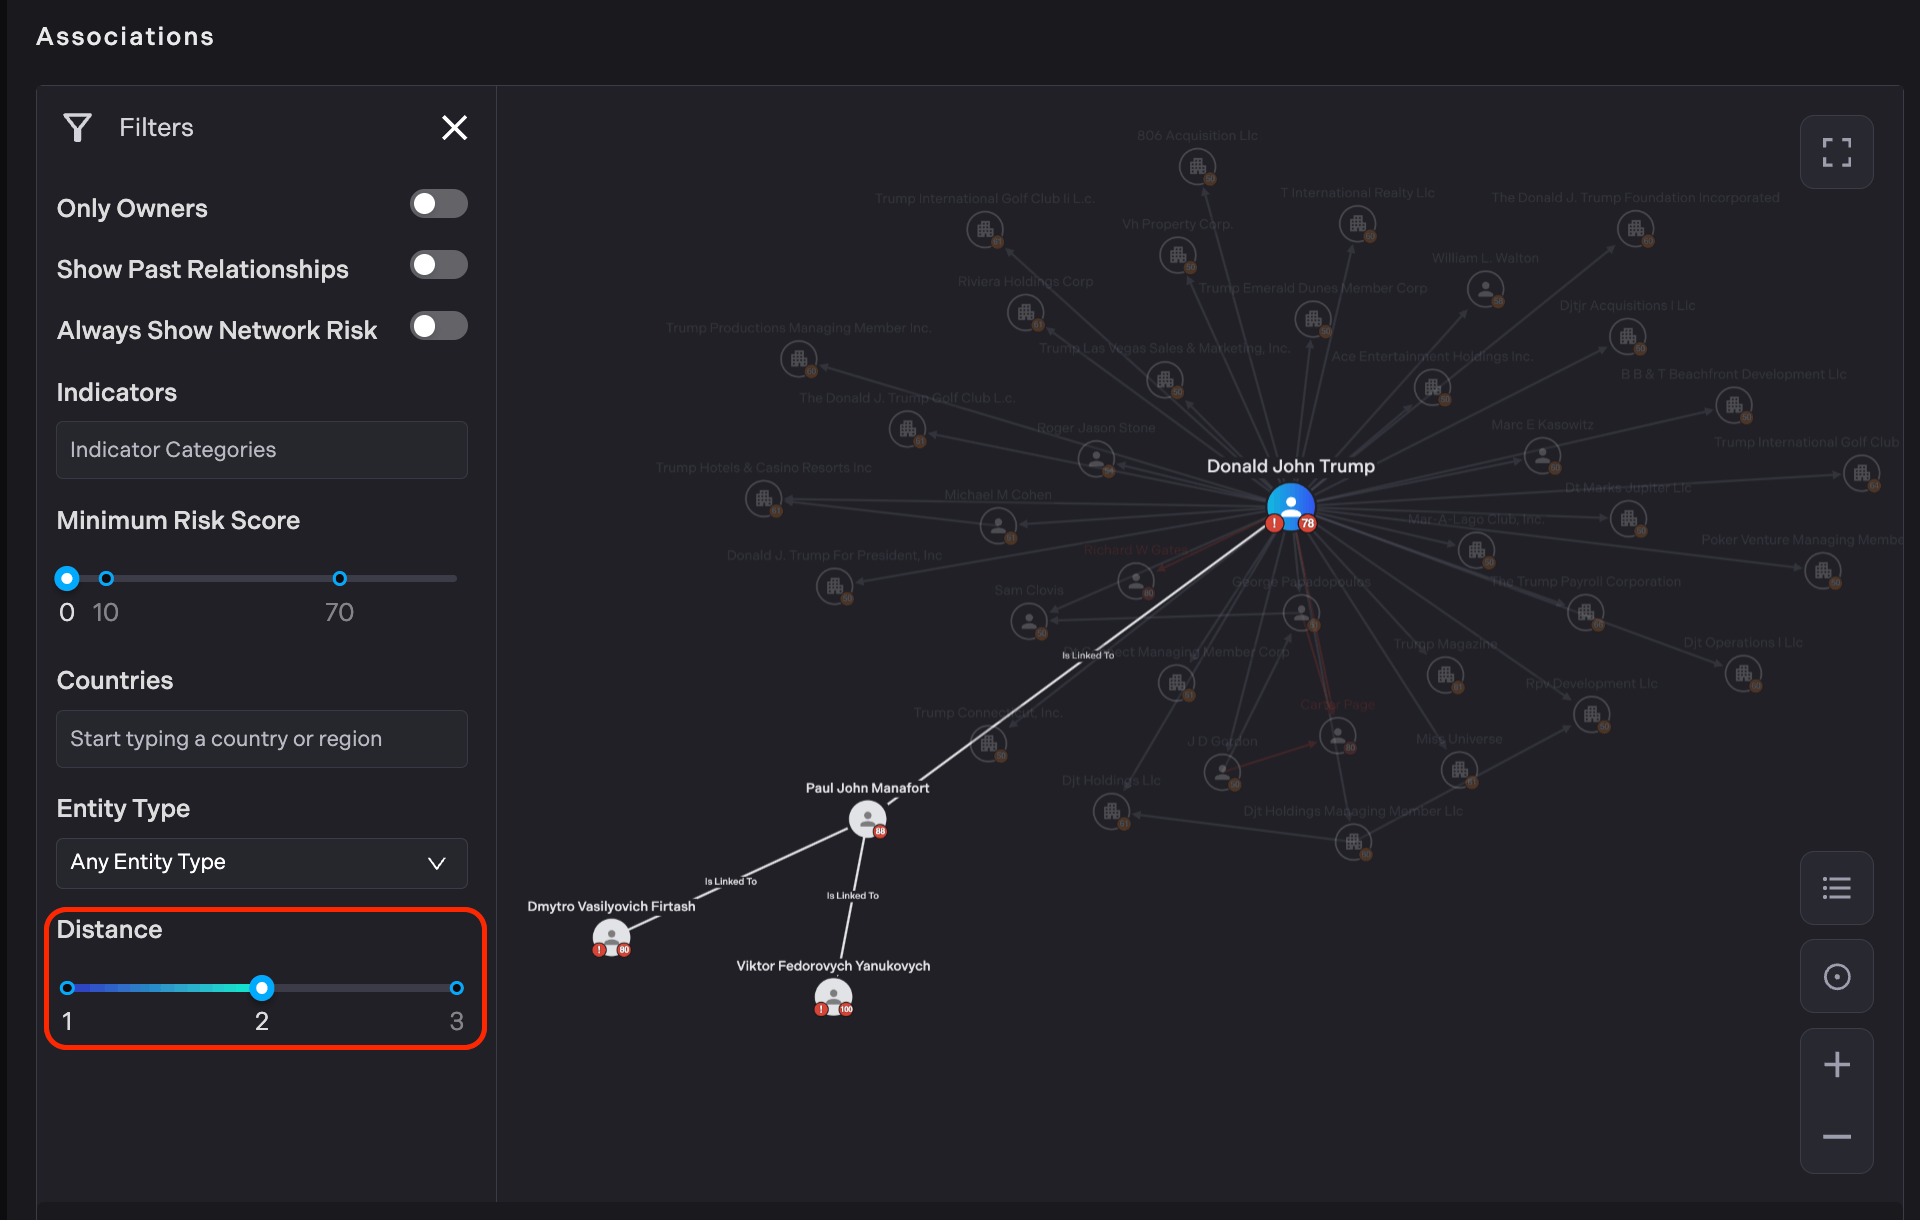
Example of 3+ hops away distance.
The Relationships column includes information about hop distance, allowing users to sort relationships from direct connections to 3 hops.
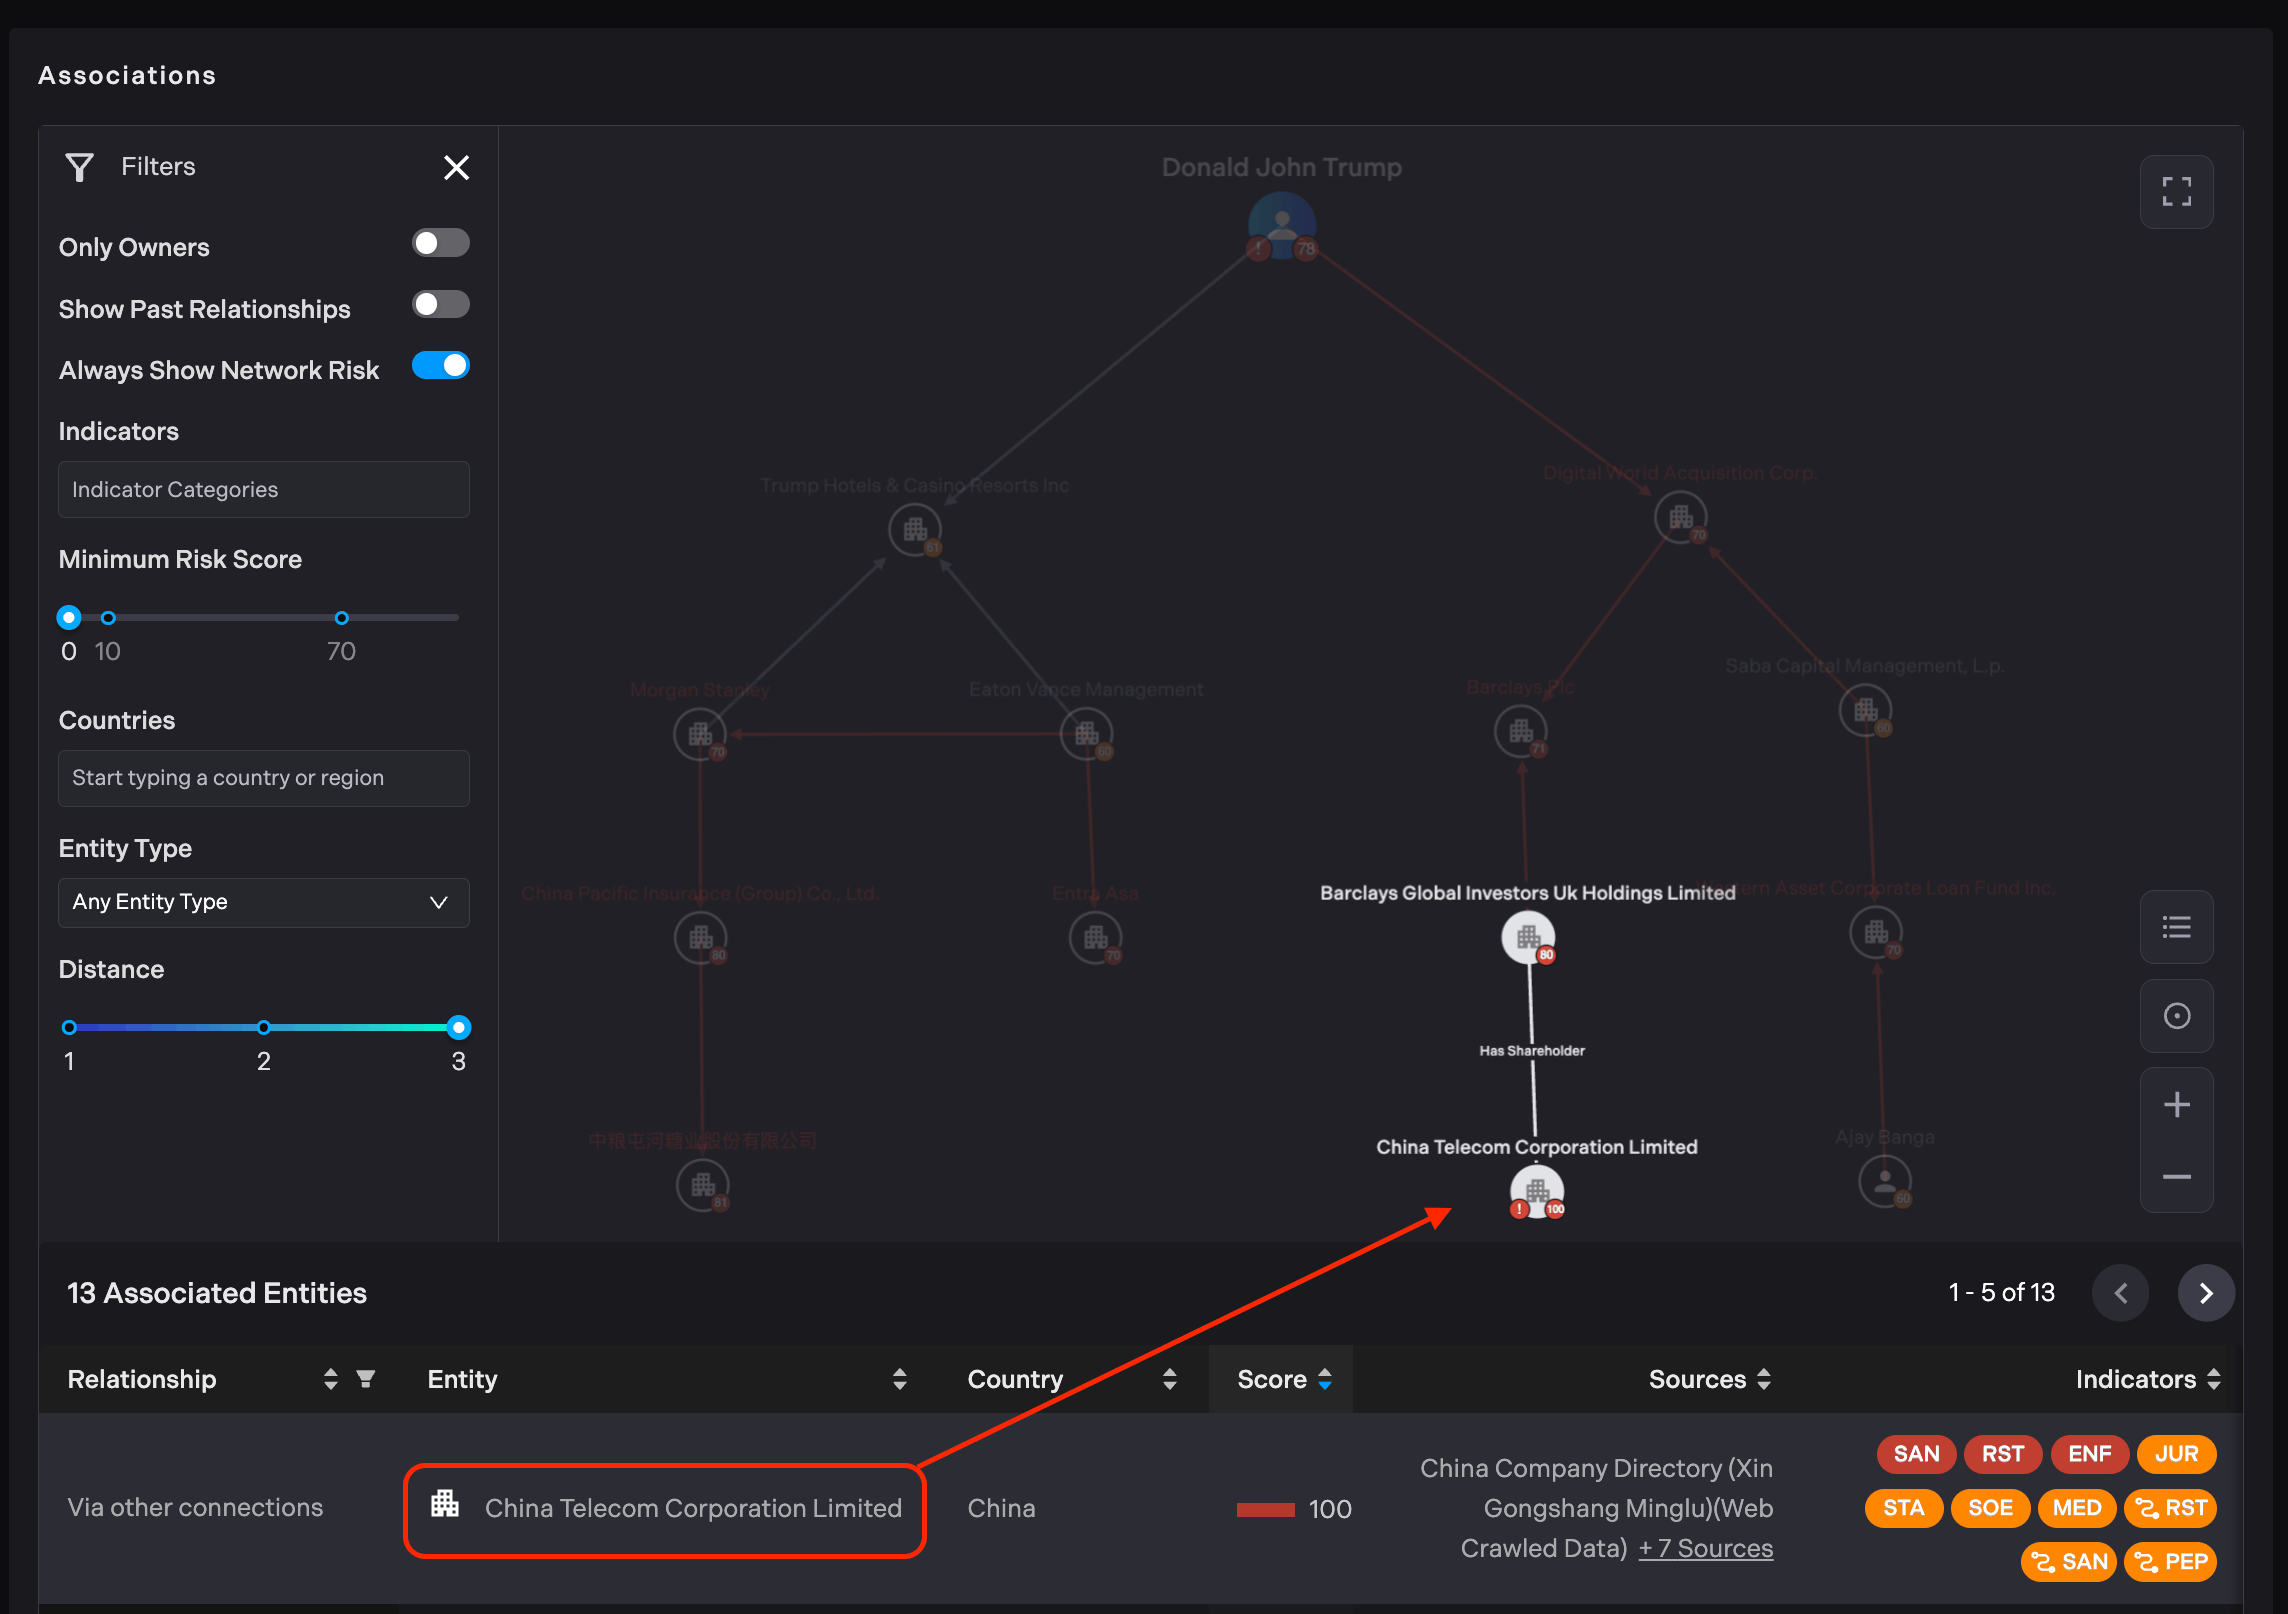
By hovering over an Entity in the Associations table, the corresponding node will be highlighted in the graph, making it easier to identify amidst a busy graph.
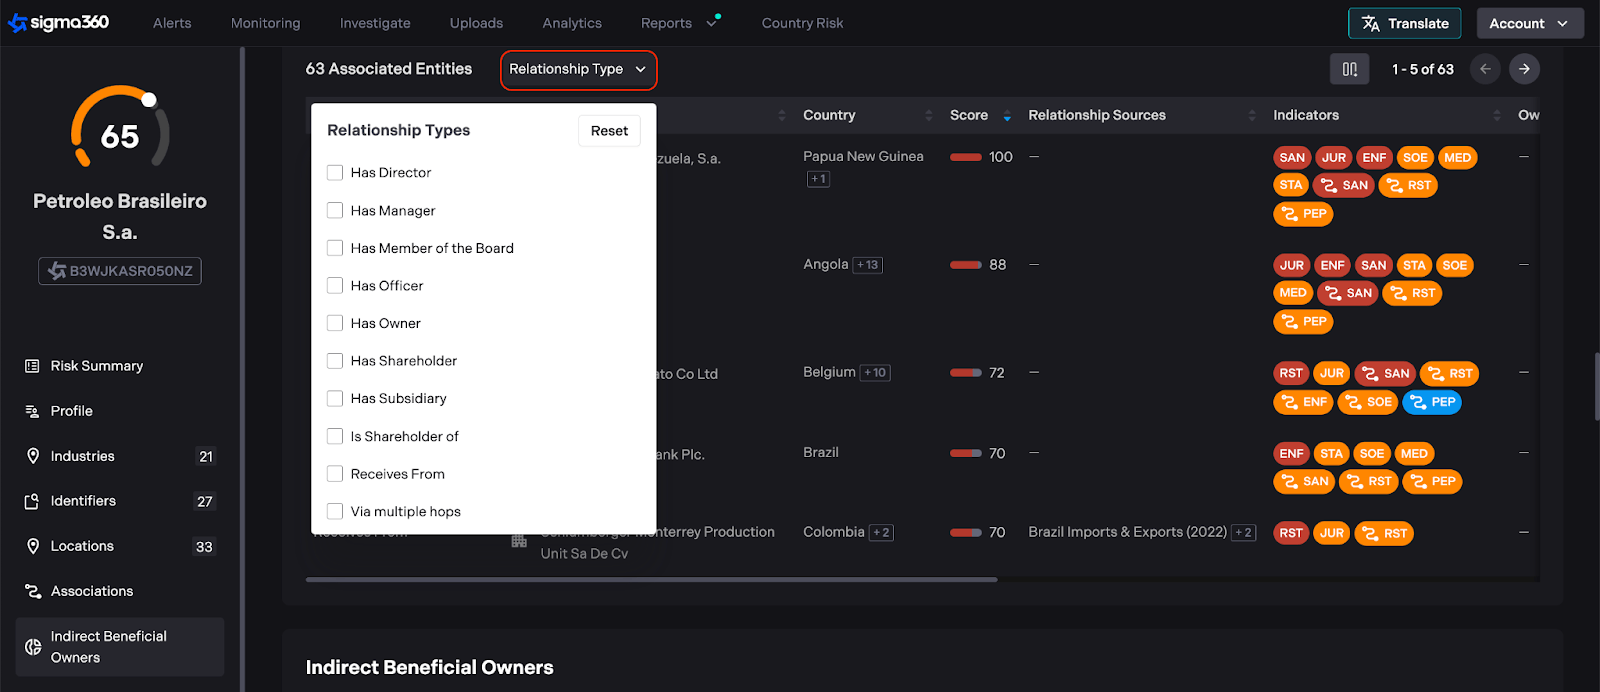
The Associations table can be filtered by the type of relationship. Please note that the graph is not affected by table filters.
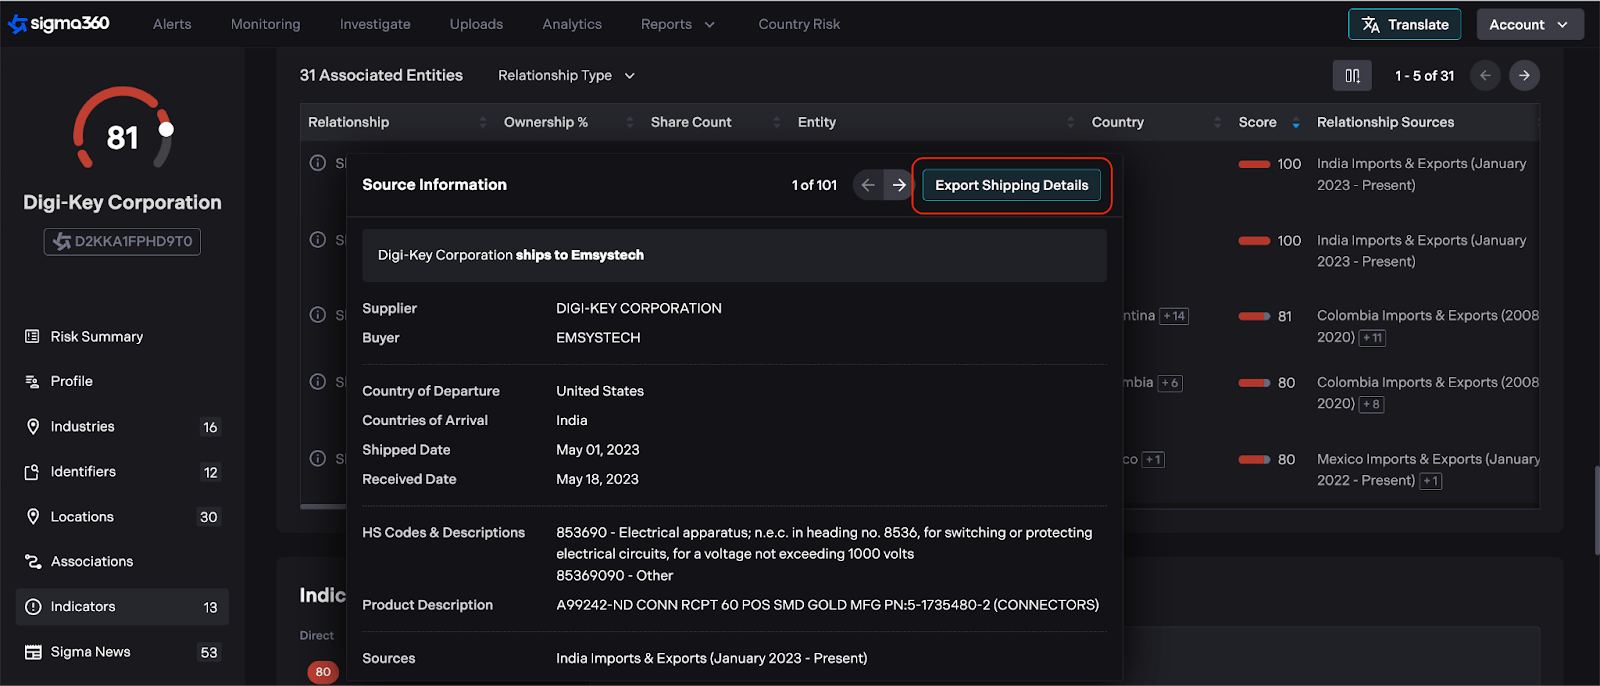
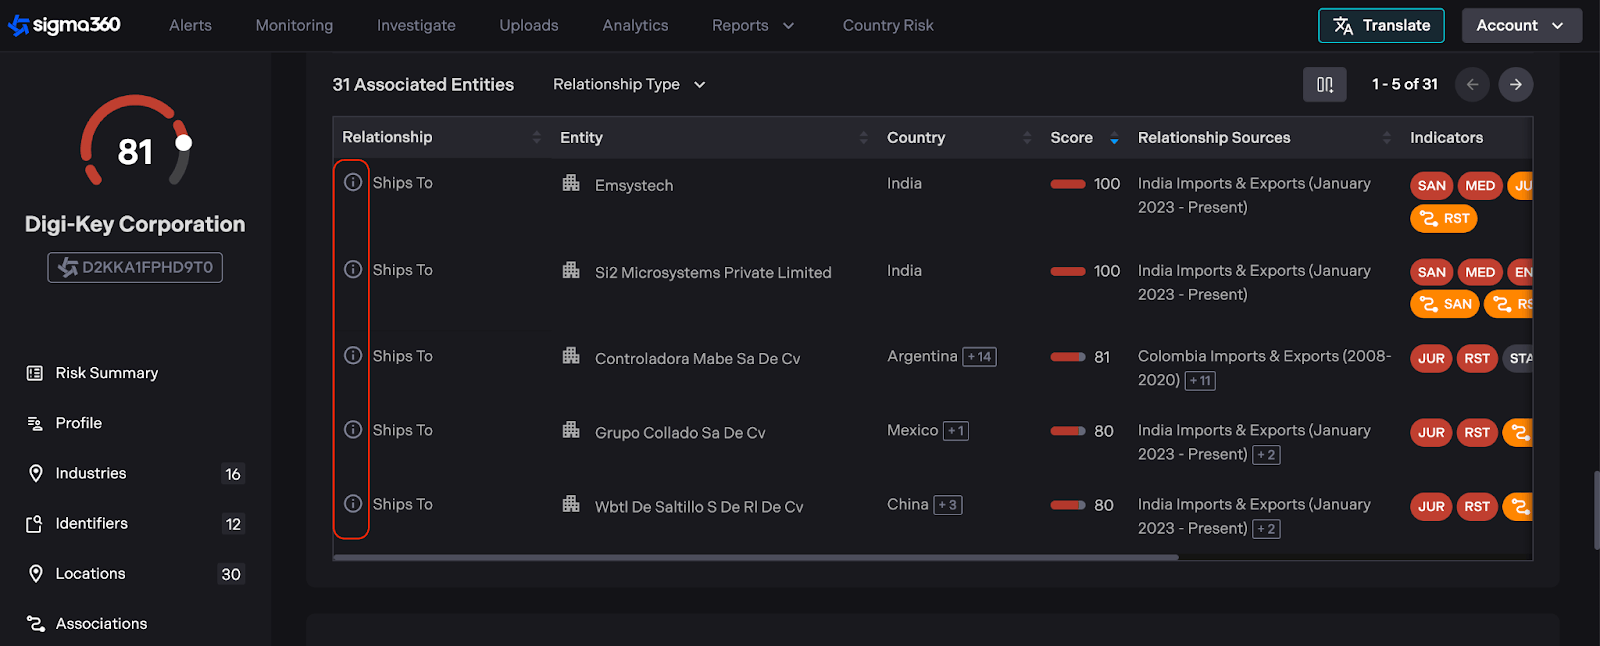
Shipment Details
Users can now request shipment details between associated entities.
Each entity listed in the Associations table now includes a “Full Details” icon. Clicking this icon reveals additional information when available.
In the popup, users can see the following fields:
-
Supplier: The entity exporting the goods
-
Buyer: The entity receiving the goods
-
Country of Departure: The country where the shipment originated
-
Countries of Arrival: The destination country for the shipment
-
Shipped date: The departure date of the shipment
-
Received date: The arrival date of the shipment
-
HS Codes & Descriptions: The Harmonized System code(s) and their descriptions for the exported products
-
Product Description: Specific description of the shipped item(s)
-
Sources: The data source used to gather this shipping information
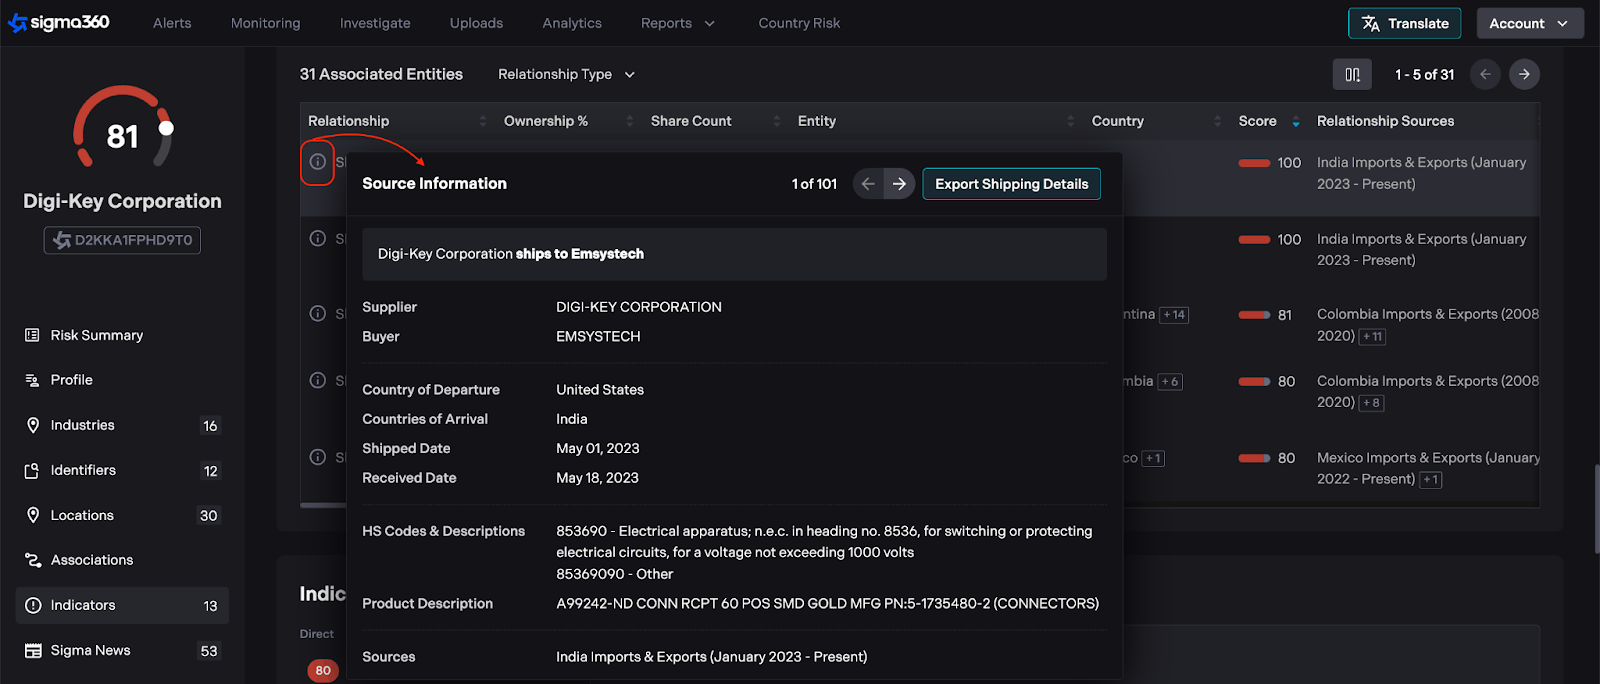
Shipment records can be exported as a CSV report by clicking the "Export" button. The report supports multiple shipment entries.